13.0 Bivariate C2N Visualizations
When we work with bivariate Categorical-to-Numeric (C2N) data, our goal is to understand how a numeric variable differs across the categories defined by a categorical variable. For example, we might want to explore how body mass varies across different species of penguins or how test scores differ between male and female students. So when we visualize that data, we want to highlight those differences clearly. The best way to visualize these differences is through bar plots, box plots, and histograms.
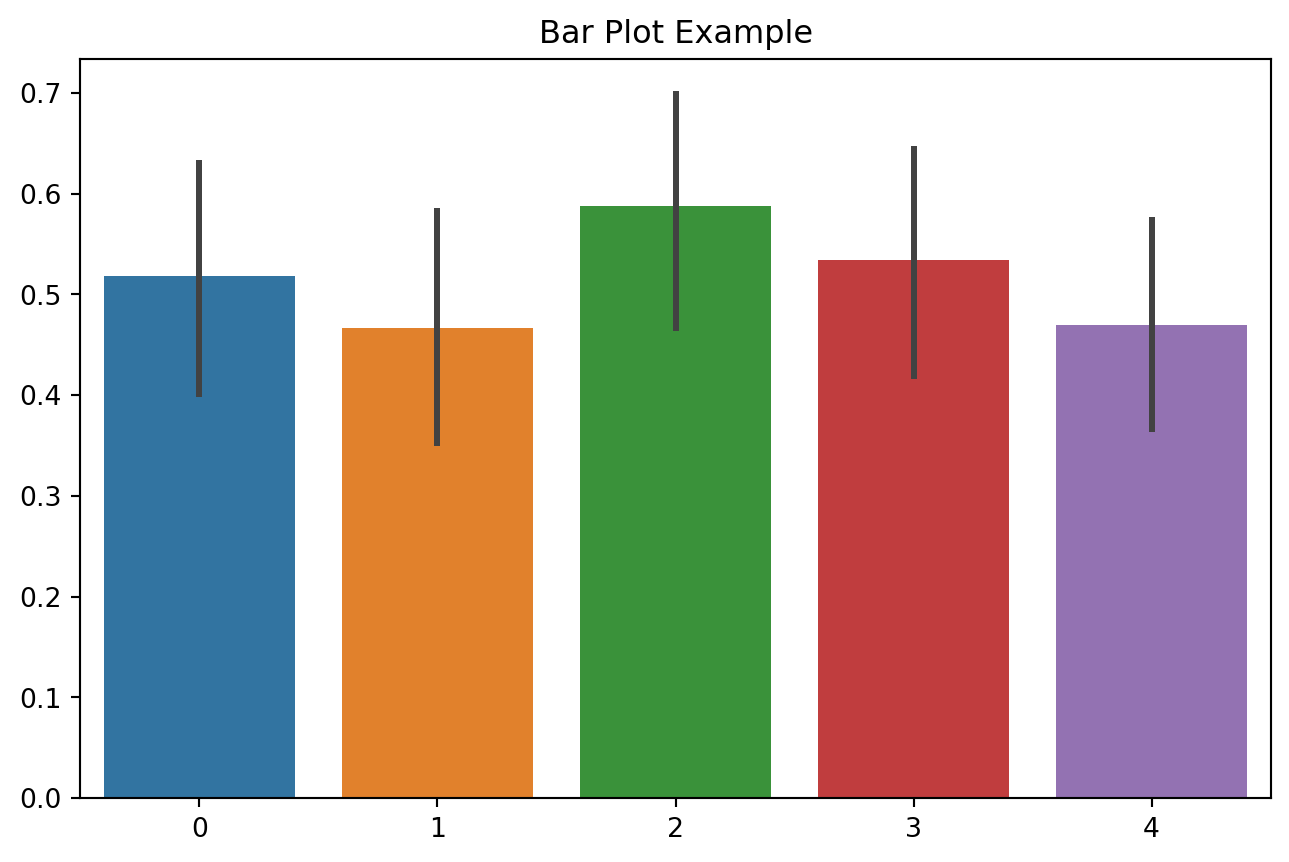
For instance, in the bar chart above, we can immediately see that column 2 has the highest average value and column 1 has the lowest average value among the five categories. This type of visualization allows us to quickly compare the means across different categories and identify which category stands out.
Our goal is to make it clear how numeric values differ across categories in a way that presents meaningful information to the reader.