import pandas as pd
import numpy as np

# Load the penguins dataset
url = "https://raw.githubusercontent.com/dataprofessor/data/refs/heads/master/penguins_cleaned.csv"
df = pd.read_csv(url)12.1 T-Tests
Bivariate C2N Statistics
What is a t-test?
A t-test is a statistical test used to determine if there is a significant difference between the means of two groups. It’s one of the most commonly used statistical tests in data analysis.
When to Use a t-test
Use a t-test when: - You have one categorical variable with 2 categories - You have one continuous numeric variable - You want to test if the means of the two groups are significantly different
t-test Output
The t-test produces two key values:
- t-statistic: A value ranging from -∞ to +∞
- Positive t-value: The first group has a greater mean than the second
- Negative t-value: The second group has a greater mean than the first
- The larger the absolute value, the greater the difference between groups
- p-value: The probability of observing this difference by chance alone
- Typically, we use α = 0.05 as our significance threshold
- p < 0.05: The difference is statistically significant
- p ≥ 0.05: The difference is not statistically significant
Visualizing Group Differences
Let’s first visualize the body mass distributions by sex using the penguins dataset:
import matplotlib.pyplot as plt
import seaborn as sns

plt.figure(figsize=(10, 6))

# Separate data by sex
males = df.loc[df["sex"] == "male"]
females = df.loc[df["sex"] == "female"]

# Create overlapping histograms with KDE
sns.histplot(data=males, x="body_mass_g", color="blue", label="Male", kde=True, alpha=0.5)
sns.histplot(data=females, x="body_mass_g", color="red", label="Female", kde=True, alpha=0.5)

# Add vertical lines for means
plt.axvline(males["body_mass_g"].mean(), c="blue", linestyle="--", linewidth=2,
            label=f"Male Mean: {males['body_mass_g'].mean():.1f}g")
plt.axvline(females["body_mass_g"].mean(), c="red", linestyle="--", linewidth=2,
            label=f"Female Mean: {females['body_mass_g'].mean():.1f}g")

plt.title("Penguin Body Mass by Sex", fontsize=14)
plt.xlabel("Body Mass (g)")
plt.ylabel("Frequency")
plt.legend()
plt.show()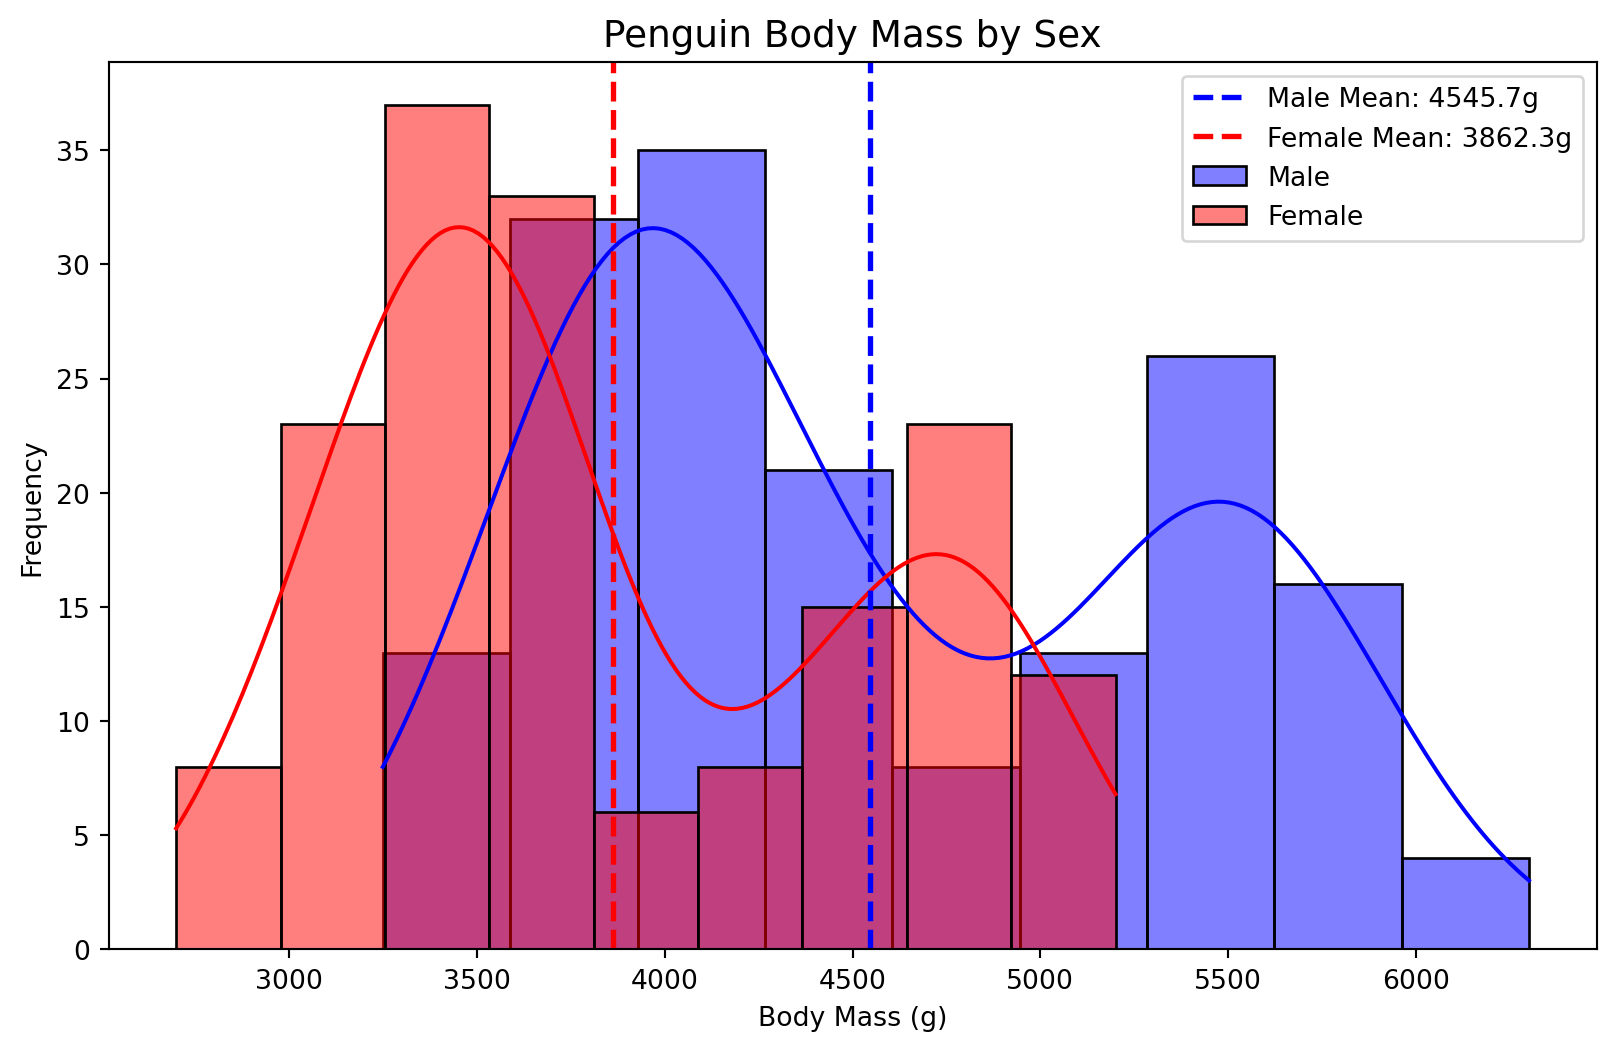
From this visualization, we can see that male penguins appear to have a higher average body mass than female penguins. But are these differences statistically significant? That’s what the t-test will tell us.
Performing a t-test in Python
We use scipy.stats.ttest_ind() to perform an independent samples t-test:
import scipy.stats as stats

# Extract body mass for each sex
males = df.loc[df['sex'] == 'male', 'body_mass_g']
females = df.loc[df['sex'] == 'female', 'body_mass_g']

# Perform t-test
result = stats.ttest_ind(males, females)

# Extract values
t, p = result
d = result.df  # degrees of freedom (attribute, not part of tuple)

print(f't-statistic: {t:.4f}')
print(f'p-value: {p:.4f}')
print(f'degrees of freedom: {d}')
t-statistic: 8.5417
p-value: 0.0000
degrees of freedom: 331.0Interpreting the Results
- The t-statistic is large and positive, indicating males have significantly higher body mass
- The p-value is much less than 0.05, indicating a significant difference
- We reject the null hypothesis: Male and female penguins have significantly different body masses
Critical t-Value
We can also determine statistical significance by comparing our t-statistic to a critical t-value. This is the threshold value that the absolute t-statistic must exceed to be considered significant.
Calculating the Critical t-Value
The critical t-value depends on: 1. Degrees of freedom (df): n₁ + n₂ - 2, where n₁ and n₂ are the sample sizes 2. Significance level (α): Typically 0.05 for a 95% confidence level
import scipy.stats as stats

# Degrees of freedom (from our t-test result)
df_value = result.df

# Significance level
alpha = 0.05

# Calculate critical t-value (two-tailed test)
critical_t = stats.t.ppf(1 - alpha / 2, df_value)

print(f'Critical t-value: {critical_t:.4f}')
Critical t-value: 1.9672Now we can compare our critical-t against our t-statistic. If our t-statistic is greater than the critical-t, we reject the null hypothesis. Our critical t-value (1.9672) is less than the absolute value of our t-statistic (8.5417). Since the null hypothesis predicts no difference between groups, rejecting the null hypothesis means that there is a significant statistical difference between male and female penguins because the t-statistic surpassed the threshold established by the critical t-value.
Since the absolute value of our t-statistic exceeds the critical t-value, we reject the null hypothesis. This confirms our p-value interpretation: there is a statistically significant difference in body mass between male and female penguins in our dataset.
Summary
t-tests allow us to: - Compare means between two groups - Determine if observed differences are statistically significant - Quantify the strength of evidence against the null hypothesis
Key takeaways: - Use scipy.stats.ttest_ind() for independent samples - Check the p-value against α = 0.05 - Or compare |t| to the critical t-value - Both methods lead to the same conclusion