Sometimes we want to visualize relationships across multiple dimensions (think categories or groups) in our bivariate N2N plots. This can be achieved by creating separate plots for each dimension or by using facets to display multiple dimensions within a single plot.
For instance, let’s look at our penguin dataset again.
import pandas as pdimport matplotlib.pyplot as pltimport seaborn as sns# Load the penguin dataseturl ="https://raw.githubusercontent.com/dataprofessor/data/refs/heads/master/penguins_cleaned.csv"penguins = pd.read_csv(url)penguins.head()
species
island
bill_length_mm
bill_depth_mm
flipper_length_mm
body_mass_g
sex
0
Adelie
Torgersen
39.1
18.7
181
3750
male
1
Adelie
Torgersen
39.5
17.4
186
3800
female
2
Adelie
Torgersen
40.3
18.0
195
3250
female
3
Adelie
Torgersen
36.7
19.3
193
3450
female
4
Adelie
Torgersen
39.3
20.6
190
3650
male
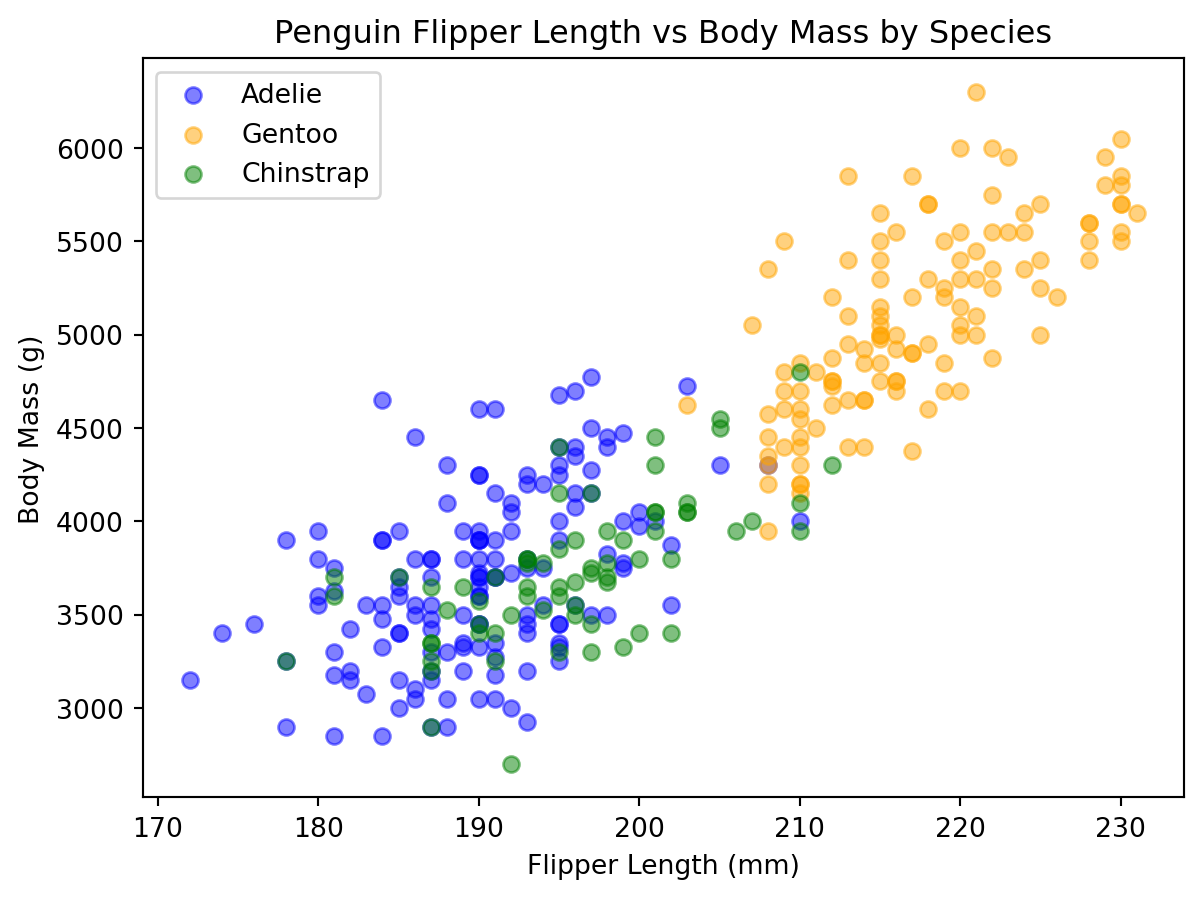
We can see that the dataset contains a categorical variable species that indicates the species of each penguin. We can create separate scatter plots for each species to visualize the relationship between flipper length and body mass.
When we look at the categories available in species, we can create separate scatter plots for each species and place them all on the same figure. This would be considered a three dimensional visualization (flipper length, body mass, and species).
plt.figure(figsize=(7, 5))colors = ['blue', 'orange', 'green']for species in penguins['species'].unique(): subset = penguins[penguins['species'] == species] plt.scatter( subset['flipper_length_mm'], subset['body_mass_g'], alpha=0.5, label=species, color=colors.pop(0) # remember pop returns and removes the first item from the list ) plt.xlabel('Flipper Length (mm)')plt.ylabel('Body Mass (g)')plt.title('Penguin Flipper Length vs Body Mass by Species')plt.legend()plt.show()
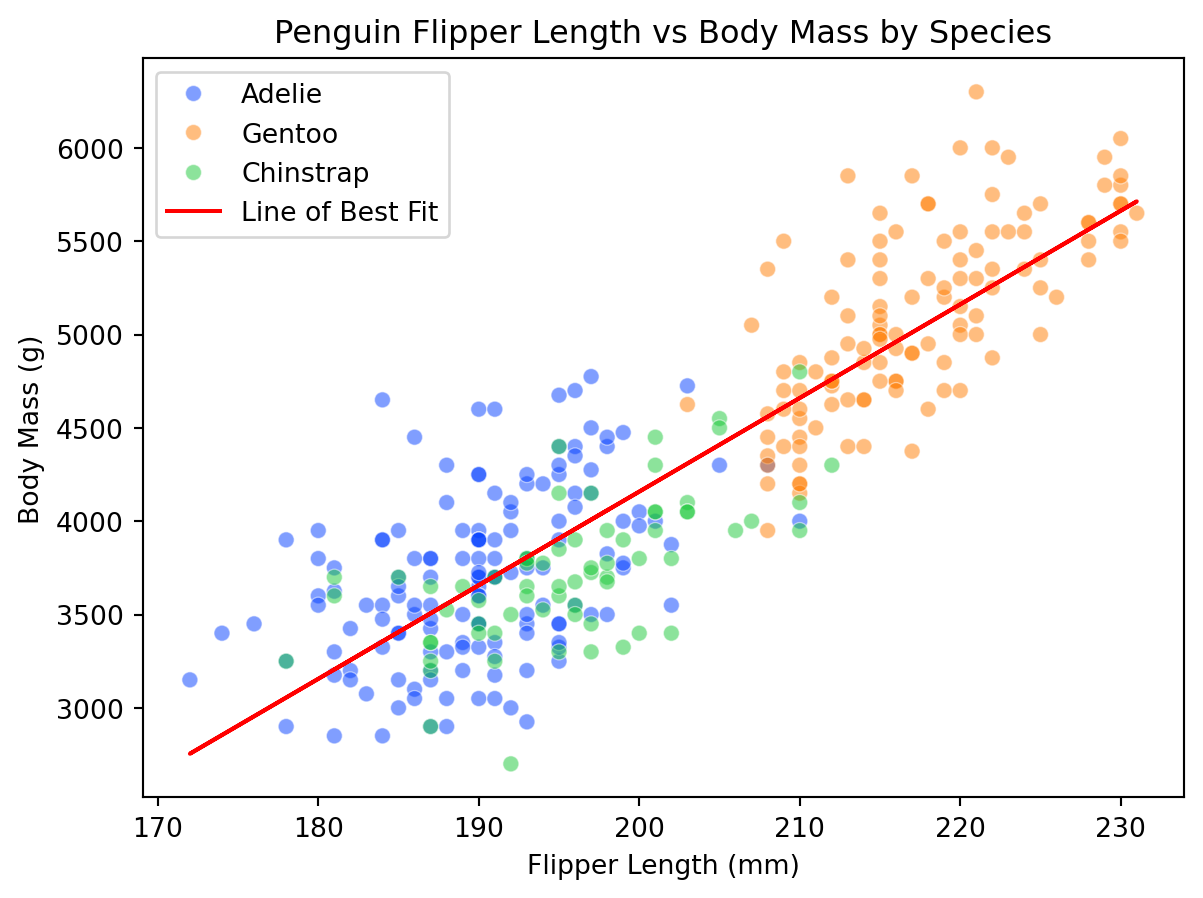
We can also do this using seaborn'sscatterplot function, which allows us to easily map the hue parameter to the species variable. Unfortunately, however, seaborn does not have a built-in way to add a line of best fit that accounts for multiple categories in a single plot. We can, however, calculate the line of best fit for the entire dataset and overlay it on the scatter plot.
from scipy import statsplt.figure(figsize=(7, 5))scat = sns.scatterplot( data=penguins, x="flipper_length_mm", y="body_mass_g", hue="species", alpha=0.5, palette="bright", # premade palette# palette=["blue", "orange", "green"], # can also include our own palette)m, b, r, p, err = stats.linregress( penguins["flipper_length_mm"], penguins["body_mass_g"])line = m * penguins["flipper_length_mm"] + bplt.plot(penguins["flipper_length_mm"], line, color="red", label="Line of Best Fit")scat.set(xlabel="Flipper Length (mm)", ylabel="Body Mass (g)")plt.title("Penguin Flipper Length vs Body Mass by Species")plt.legend()plt.show()
We can see from this plot that while there is a general trend of increasing body mass with flipper length, the relationship varies by species. Each species has its own cluster of points, and the overall line of best fit may not accurately represent the relationship for each individual species.
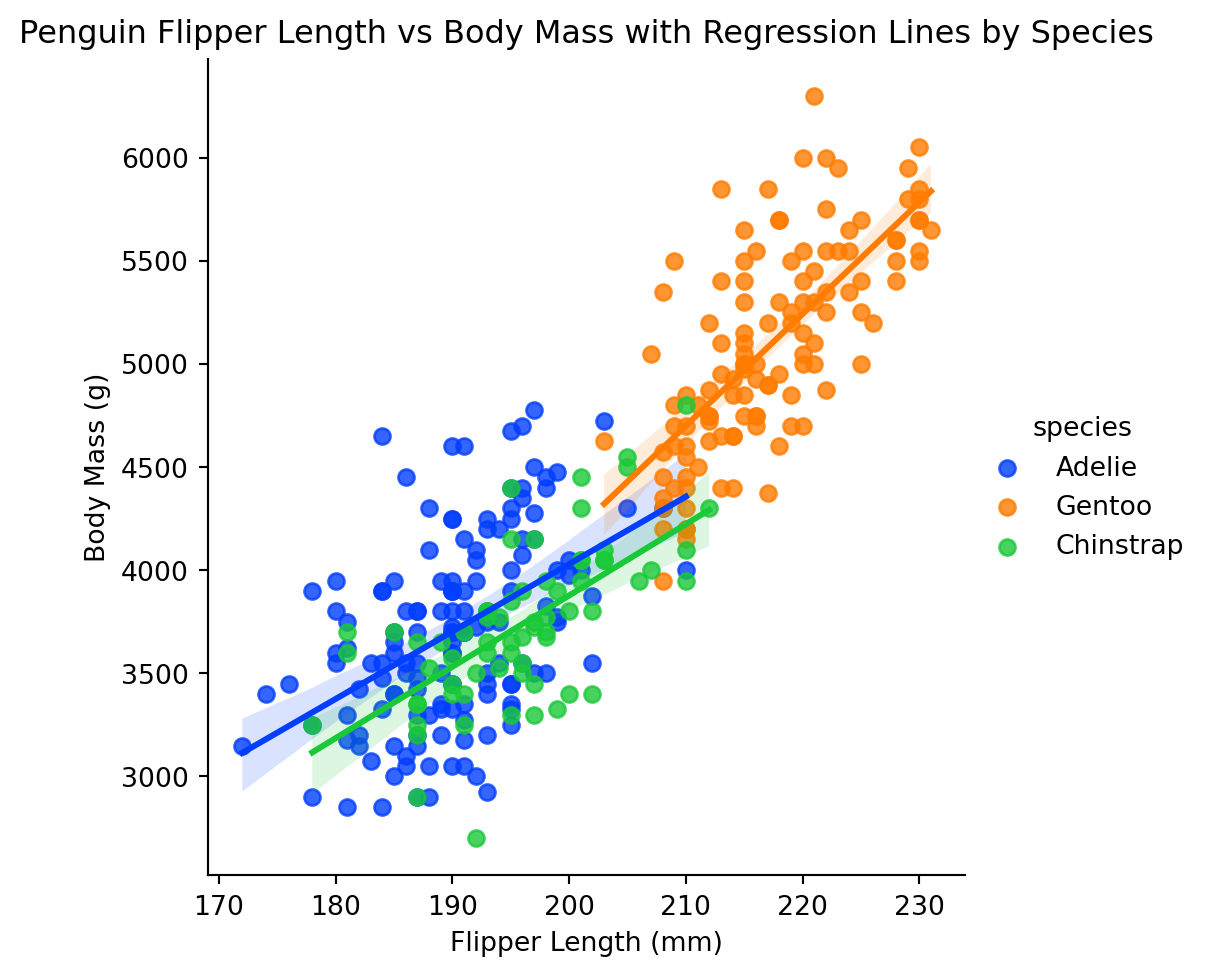
To make this a bit clearer, we can use seaborn'slmplot function, which allows us to create separate regression lines for each species using the hue parameter.
Here is the explanation of the difference between regplot and lmplot from the seaborn documentation:
These functions draw similar plots, but regplot() is an axes-level function, and lmplot() is a figure-level function. Additionally, regplot() accepts the x and y variables in a variety of formats including simple numpy arrays, pandas.Series objects, or as references to variables in a pandas.DataFrame object passed to data. In contrast, lmplot() has data as a required parameter and the x and y variables must be specified as strings. Finally, only lmplot() has hue as a parameter.
plt.figure(figsize=(7, 5))lm = sns.lmplot( data=penguins, x="flipper_length_mm", y="body_mass_g", hue="species", palette="bright",)lm.set(xlabel="Flipper Length (mm)", ylabel="Body Mass (g)")plt.title("Penguin Flipper Length vs Body Mass with Regression Lines by Species")plt.show()
<Figure size 672x480 with 0 Axes>
Four Dimension Visualizations
Now we can also include a fourth dimension by varying the
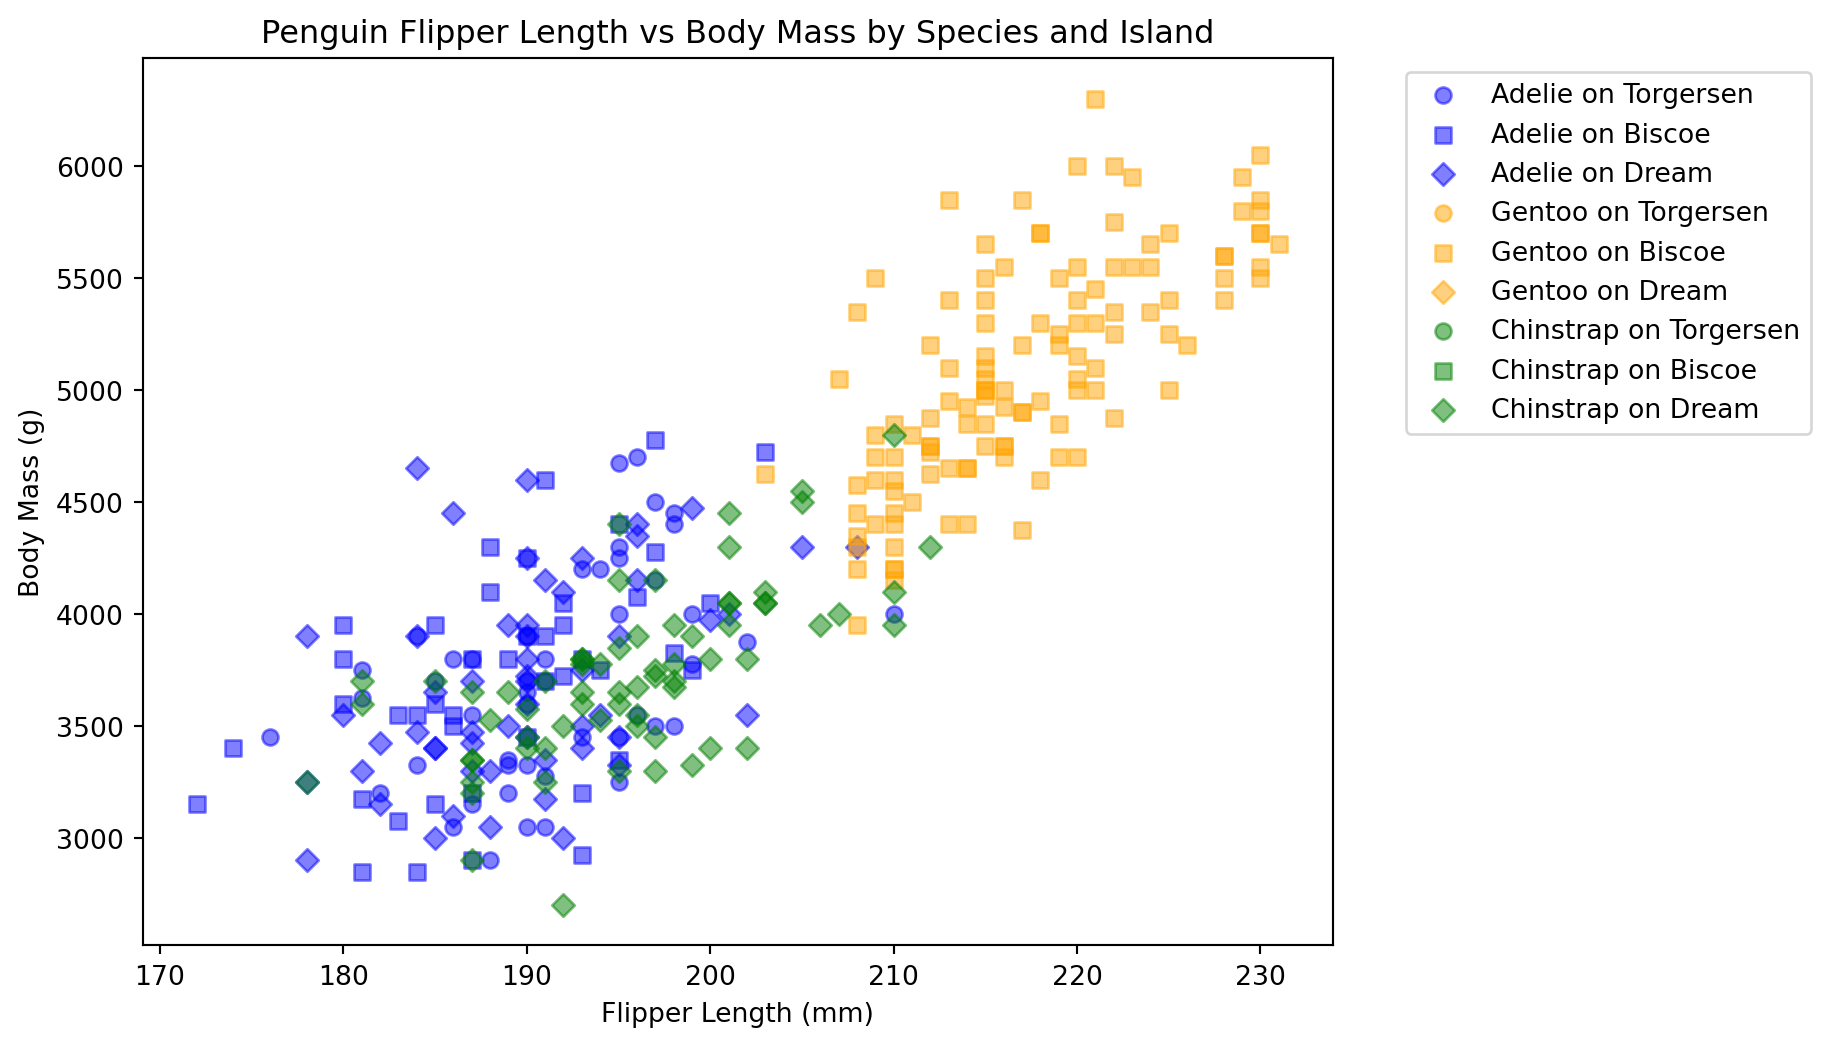
We will use different markers for each island in addition to different colors for each species.
species = penguins["species"].unique()islands = penguins["island"].unique()colors = ["blue", "orange", "green"]markers = ["o", "s", "D"]plt.figure(figsize=(8, 6))for spec in species:for island in islands: subset = penguins[ (penguins["species"] == spec) & (penguins["island"] == island) ] plt.scatter( subset["flipper_length_mm"], subset["body_mass_g"], alpha=0.5, label=f"{spec} on {island}", color=colors[list(species).index(spec) ], # returns index of species to select color marker=markers[list(islands).index(island) ], # returns index of island to select marker )plt.xlabel("Flipper Length (mm)")plt.ylabel("Body Mass (g)")plt.title("Penguin Flipper Length vs Body Mass by Species and Island")plt.legend(bbox_to_anchor=(1.05, 1), loc="upper left")plt.show()
Once again, we can see that the relationship between flipper length and body mass varies not only by species but also by island. Each combination of species and island has its own cluster of points, highlighting the complexity of the relationships in the dataset.