import pandas as pdimport matplotlib.pyplot as pltimport seaborn as snsimport asturl ="https://raw.githubusercontent.com/nkmwicz/worldcup2018data/refs/heads/main/cleaned_events_world_cup2018.csv"df = pd.read_csv(url)df['tags'] = df['tags'].apply(ast.literal_eval)shots = df.loc[df['eventName'] =='Shot']shots['goal'] = shots['tags'].apply(lambda x: "Goal"in x).astype(int)shots
/tmp/ipykernel_356794/2378109605.py:12: SettingWithCopyWarning:


A value is trying to be set on a copy of a slice from a DataFrame.
Try using .loc[row_indexer,col_indexer] = value instead

See the caveats in the documentation: https://pandas.pydata.org/pandas-docs/stable/user_guide/indexing.html#returning-a-view-versus-a-copy
eventId
subEventName
tags
playerId
matchId
eventName
teamId
matchPeriod
eventSec
subEventId
id
x1
y1
x2
y2
goal
117
10
Shot
[Right foot, Blocked, Not accurate]
Yasir Gharsan Al Shahrani
Russia - Saudi Arabia, 5 - 0
Shot
Saudi Arabia
1H
327.142941
Shot
258612248
87
27
100.0
100.0
0
154
10
Shot
[Right foot, Blocked, Not accurate]
Alexandr Samedov
Russia - Saudi Arabia, 5 - 0
Shot
Russia
1H
407.123899
Shot
258612244
90
69
0.0
0.0
0
197
10
Shot
[Left foot, Blocked, Not accurate]
Yuri Zhirkov
Russia - Saudi Arabia, 5 - 0
Shot
Russia
1H
526.276996
Shot
258612307
86
30
0.0
0.0
0
232
10
Shot
[Goal, Head/body, Opportunity, Position: Goal ...
Yury Gazinskiy
Russia - Saudi Arabia, 5 - 0
Shot
Russia
1H
693.396917
Shot
258612368
93
60
0.0
0.0
1
372
10
Shot
[Left foot, Blocked, Not accurate]
Mohammad Ibrahim Al Sahlawi
Russia - Saudi Arabia, 5 - 0
Shot
Saudi Arabia
1H
1266.276267
Shot
258612558
86
38
100.0
100.0
0
...
...
...
...
...
...
...
...
...
...
...
...
...
...
...
...
...
101371
10
Shot
[Goal, Right foot, Opportunity, Position: Goal...
Mario Mand\u017euki\u0107
France - Croatia, 4 - 2
Shot
Croatia
2H
1389.182669
Shot
263885208
92
53
100.0
100.0
1
101457
10
Shot
[Right foot, Opportunity, Position: Out center...
\u0160ime Vrsaljko
France - Croatia, 4 - 2
Shot
Croatia
2H
1802.299261
Shot
263885299
65
61
100.0
100.0
0
101493
10
Shot
[Left foot, Blocked, Not accurate]
Ivan Rakiti\u0107
France - Croatia, 4 - 2
Shot
Croatia
2H
1933.996341
Shot
263885348
81
33
100.0
100.0
0
101620
10
Shot
[Left foot, Opportunity, Position: Goal center...
Nabil Fekir
France - Croatia, 4 - 2
Shot
France
2H
2487.443304
Shot
263885485
78
76
0.0
0.0
0
101653
10
Shot
[Right foot, Opportunity, Position: Out high r...
Ivan Rakiti\u0107
France - Croatia, 4 - 2
Shot
Croatia
2H
2589.084194
Shot
263885575
70
29
100.0
100.0
0
1419 rows × 16 columns
Now we have the shots. Let’s find out how close the shots are from their target. This dataset creates a grid from 0-100 on the x and y axes. The attacking team is always shooting toward the goal on the 100 x-axis. The center point of the goal is (100,50). The grid, then, works as a percentage system. Knowing that, we can use the Euclidean distance computation to find the distance after we convert all coordinates into real meters.
To convert the location on the pitch into a meter marker. We can set the average length to 105 meters and average width to 70.
/tmp/ipykernel_356794/2739217068.py:4: SettingWithCopyWarning:


A value is trying to be set on a copy of a slice from a DataFrame.
Try using .loc[row_indexer,col_indexer] = value instead

See the caveats in the documentation: https://pandas.pydata.org/pandas-docs/stable/user_guide/indexing.html#returning-a-view-versus-a-copy

/tmp/ipykernel_356794/2739217068.py:5: SettingWithCopyWarning:


A value is trying to be set on a copy of a slice from a DataFrame.
Try using .loc[row_indexer,col_indexer] = value instead

See the caveats in the documentation: https://pandas.pydata.org/pandas-docs/stable/user_guide/indexing.html#returning-a-view-versus-a-copy

/tmp/ipykernel_356794/2739217068.py:6: SettingWithCopyWarning:


A value is trying to be set on a copy of a slice from a DataFrame.
Try using .loc[row_indexer,col_indexer] = value instead

See the caveats in the documentation: https://pandas.pydata.org/pandas-docs/stable/user_guide/indexing.html#returning-a-view-versus-a-copy

/tmp/ipykernel_356794/2739217068.py:7: SettingWithCopyWarning:


A value is trying to be set on a copy of a slice from a DataFrame.
Try using .loc[row_indexer,col_indexer] = value instead

See the caveats in the documentation: https://pandas.pydata.org/pandas-docs/stable/user_guide/indexing.html#returning-a-view-versus-a-copy

/tmp/ipykernel_356794/2739217068.py:8: SettingWithCopyWarning:


A value is trying to be set on a copy of a slice from a DataFrame.
Try using .loc[row_indexer,col_indexer] = value instead

See the caveats in the documentation: https://pandas.pydata.org/pandas-docs/stable/user_guide/indexing.html#returning-a-view-versus-a-copy
eventId
subEventName
tags
playerId
matchId
eventName
teamId
matchPeriod
eventSec
subEventId
...
x1
y1
x2
y2
goal
m_x1
m_x2
m_y1
targetx
targety
117
10
Shot
[Right foot, Blocked, Not accurate]
Yasir Gharsan Al Shahrani
Russia - Saudi Arabia, 5 - 0
Shot
Saudi Arabia
1H
327.142941
Shot
...
87
27
100.0
100.0
0
91.35
105.0
18.9
105
35.0
154
10
Shot
[Right foot, Blocked, Not accurate]
Alexandr Samedov
Russia - Saudi Arabia, 5 - 0
Shot
Russia
1H
407.123899
Shot
...
90
69
0.0
0.0
0
94.50
0.0
48.3
105
35.0
197
10
Shot
[Left foot, Blocked, Not accurate]
Yuri Zhirkov
Russia - Saudi Arabia, 5 - 0
Shot
Russia
1H
526.276996
Shot
...
86
30
0.0
0.0
0
90.30
0.0
21.0
105
35.0
232
10
Shot
[Goal, Head/body, Opportunity, Position: Goal ...
Yury Gazinskiy
Russia - Saudi Arabia, 5 - 0
Shot
Russia
1H
693.396917
Shot
...
93
60
0.0
0.0
1
97.65
0.0
42.0
105
35.0
372
10
Shot
[Left foot, Blocked, Not accurate]
Mohammad Ibrahim Al Sahlawi
Russia - Saudi Arabia, 5 - 0
Shot
Saudi Arabia
1H
1266.276267
Shot
...
86
38
100.0
100.0
0
90.30
105.0
26.6
105
35.0
5 rows × 21 columns
Now that we have the new meter markers for the location, we can apply the distance of the shot.
dist applies the Euclidean distance formula to find the distance between two points in a 2D space. We can use the math.dist function to calculate the distance between the shot and the target goal.
It essentially does this: ((x2 - x1)**2 + (y2 - y1)**2)**(1/2)
from math import distshots['dist'] = shots.apply(lambda row: dist([row['m_x1'], row['m_y1']], [105, 35]), axis=1)shots['dist']
/tmp/ipykernel_356794/4109726942.py:2: SettingWithCopyWarning:


A value is trying to be set on a copy of a slice from a DataFrame.
Try using .loc[row_indexer,col_indexer] = value instead

See the caveats in the documentation: https://pandas.pydata.org/pandas-docs/stable/user_guide/indexing.html#returning-a-view-versus-a-copy
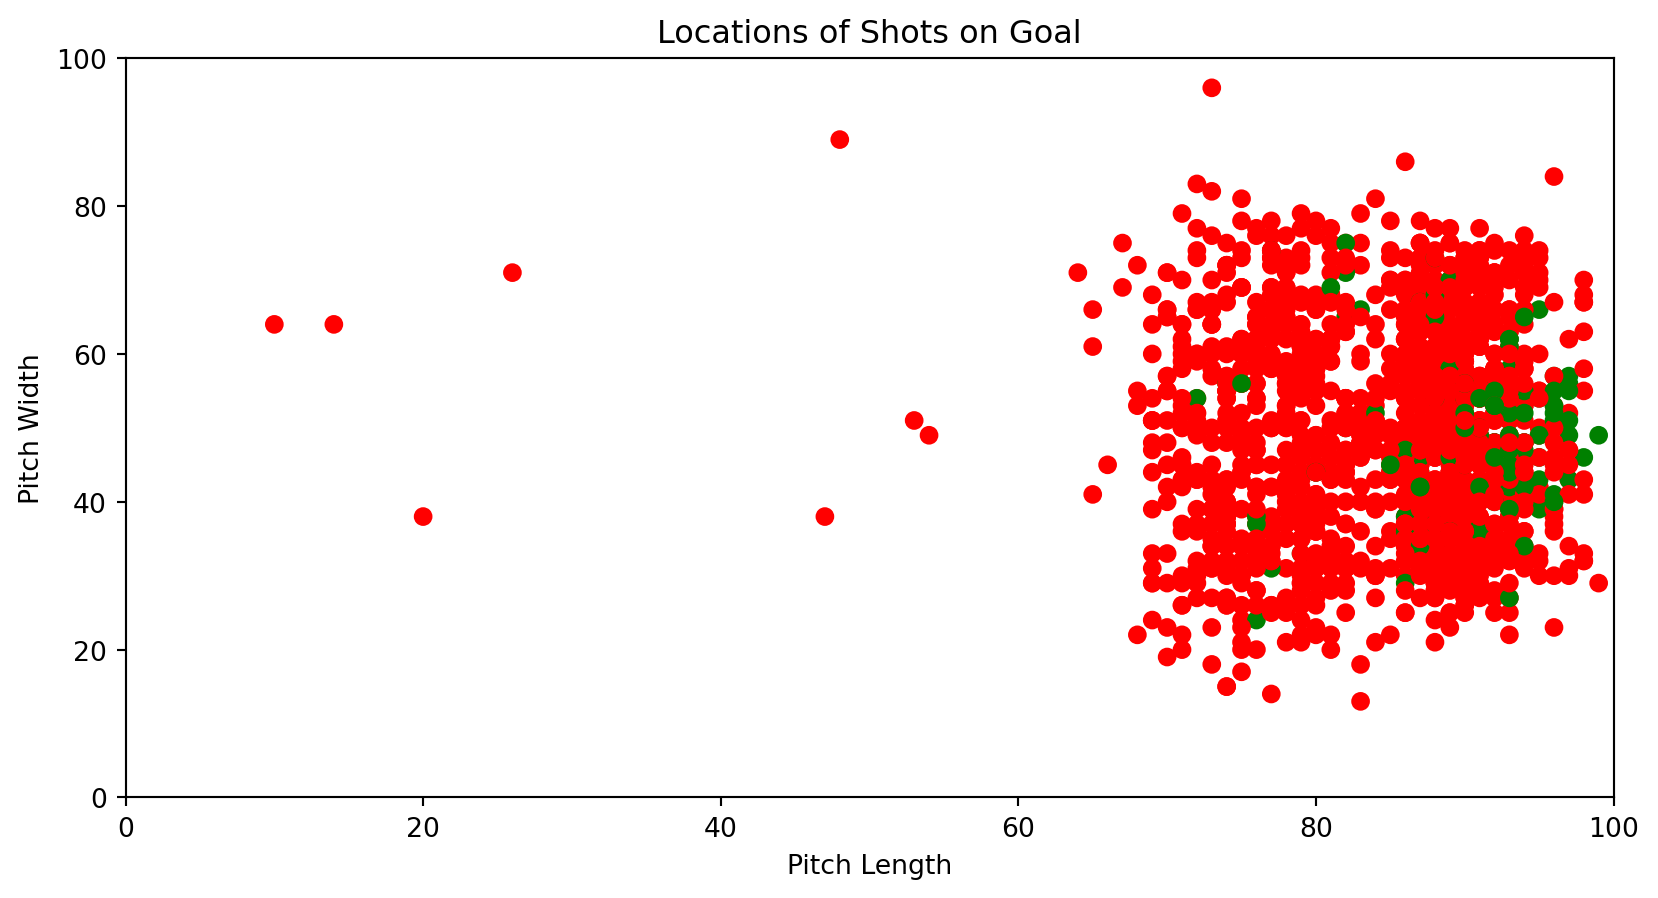
Now we have the distance of every shot that was taken and if it was a goal or not. We can now plot a number of variables here. First let’s plot the locations on the pitch from which a goal was shot. We can do this in matplotlib.
hm = {1: 'green', 0: 'red'}shots['color'] = shots['goal'].map(hm)plt.figure(figsize=(10,5))plt.scatter(x=shots['x1'], y=shots['y1'], c=shots['color'])plt.xlim([0,100])plt.ylim([0,100])plt.xlabel('Pitch Length')plt.ylabel('Pitch Width')plt.title('Locations of Shots on Goal')
/tmp/ipykernel_356794/1183847092.py:2: SettingWithCopyWarning:


A value is trying to be set on a copy of a slice from a DataFrame.
Try using .loc[row_indexer,col_indexer] = value instead

See the caveats in the documentation: https://pandas.pydata.org/pandas-docs/stable/user_guide/indexing.html#returning-a-view-versus-a-copy
Text(0.5, 1.0, 'Locations of Shots on Goal')
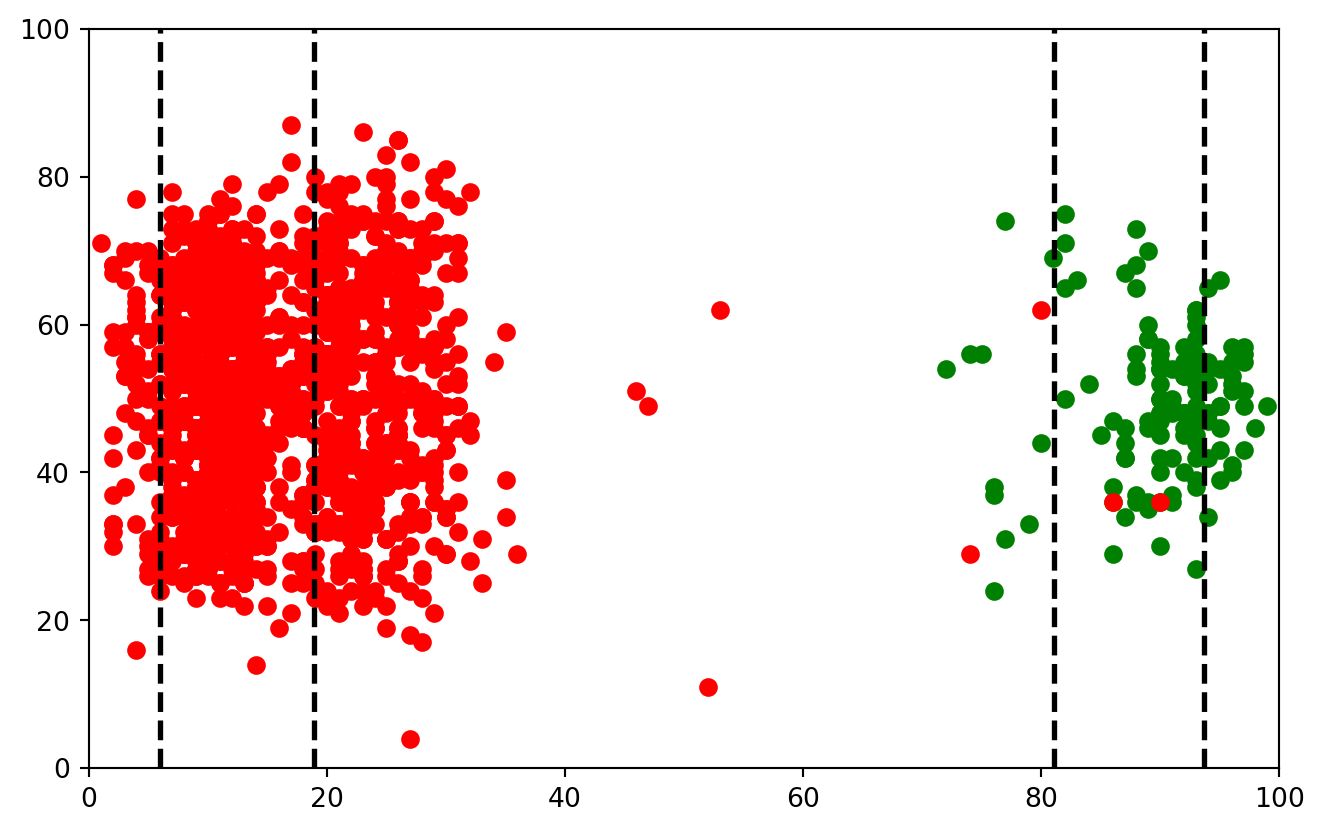
We can probably make this much better by separating goals from non-goals
/tmp/ipykernel_356794/1938120467.py:3: SettingWithCopyWarning:


A value is trying to be set on a copy of a slice from a DataFrame.
Try using .loc[row_indexer,col_indexer] = value instead

See the caveats in the documentation: https://pandas.pydata.org/pandas-docs/stable/user_guide/indexing.html#returning-a-view-versus-a-copy

/tmp/ipykernel_356794/1938120467.py:4: SettingWithCopyWarning:


A value is trying to be set on a copy of a slice from a DataFrame.
Try using .loc[row_indexer,col_indexer] = value instead

See the caveats in the documentation: https://pandas.pydata.org/pandas-docs/stable/user_guide/indexing.html#returning-a-view-versus-a-copy

/tmp/ipykernel_356794/1938120467.py:5: SettingWithCopyWarning:


A value is trying to be set on a copy of a slice from a DataFrame.
Try using .loc[row_indexer,col_indexer] = value instead

See the caveats in the documentation: https://pandas.pydata.org/pandas-docs/stable/user_guide/indexing.html#returning-a-view-versus-a-copy
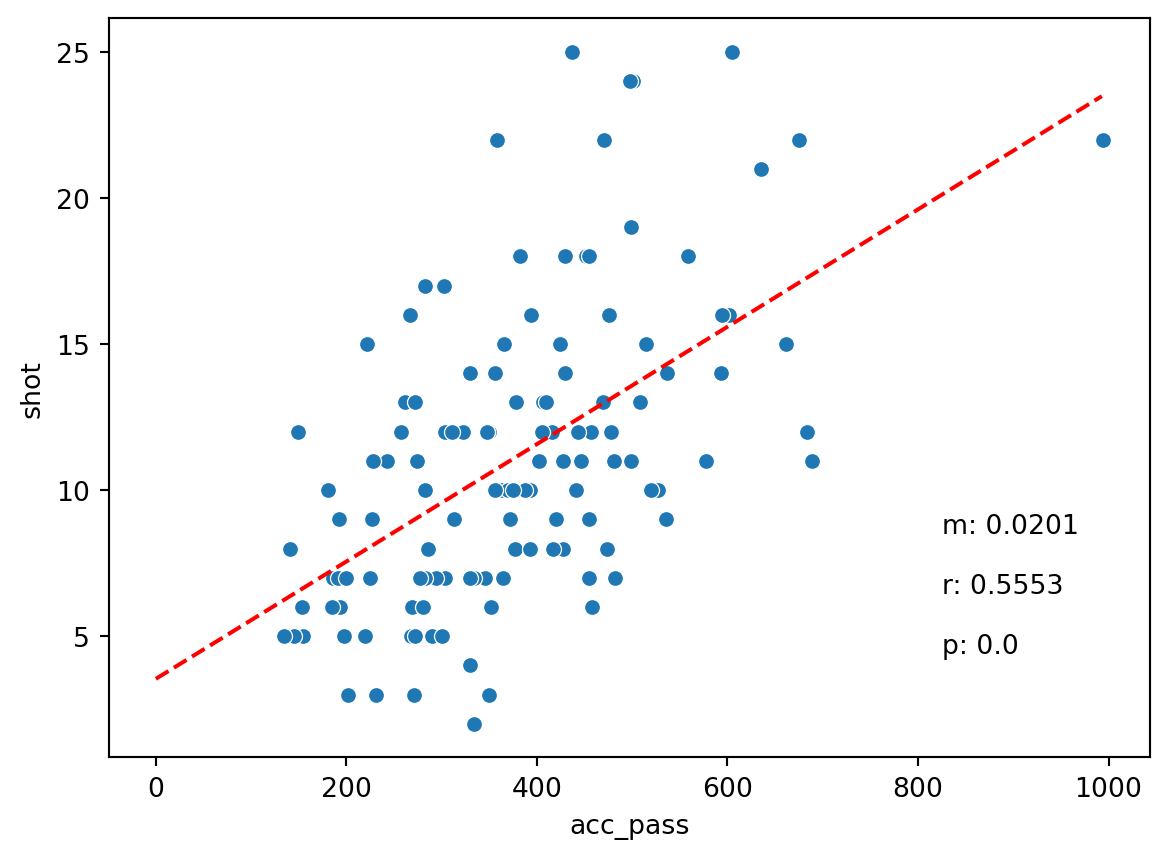
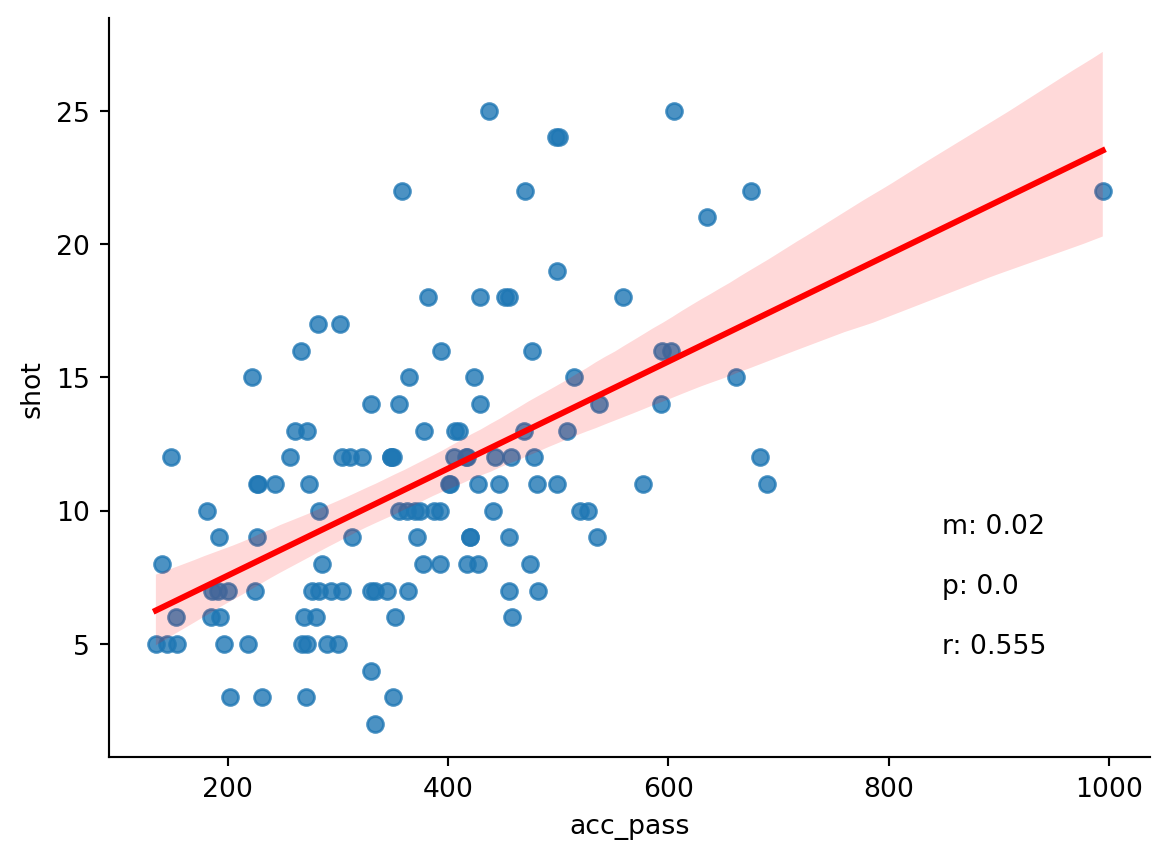
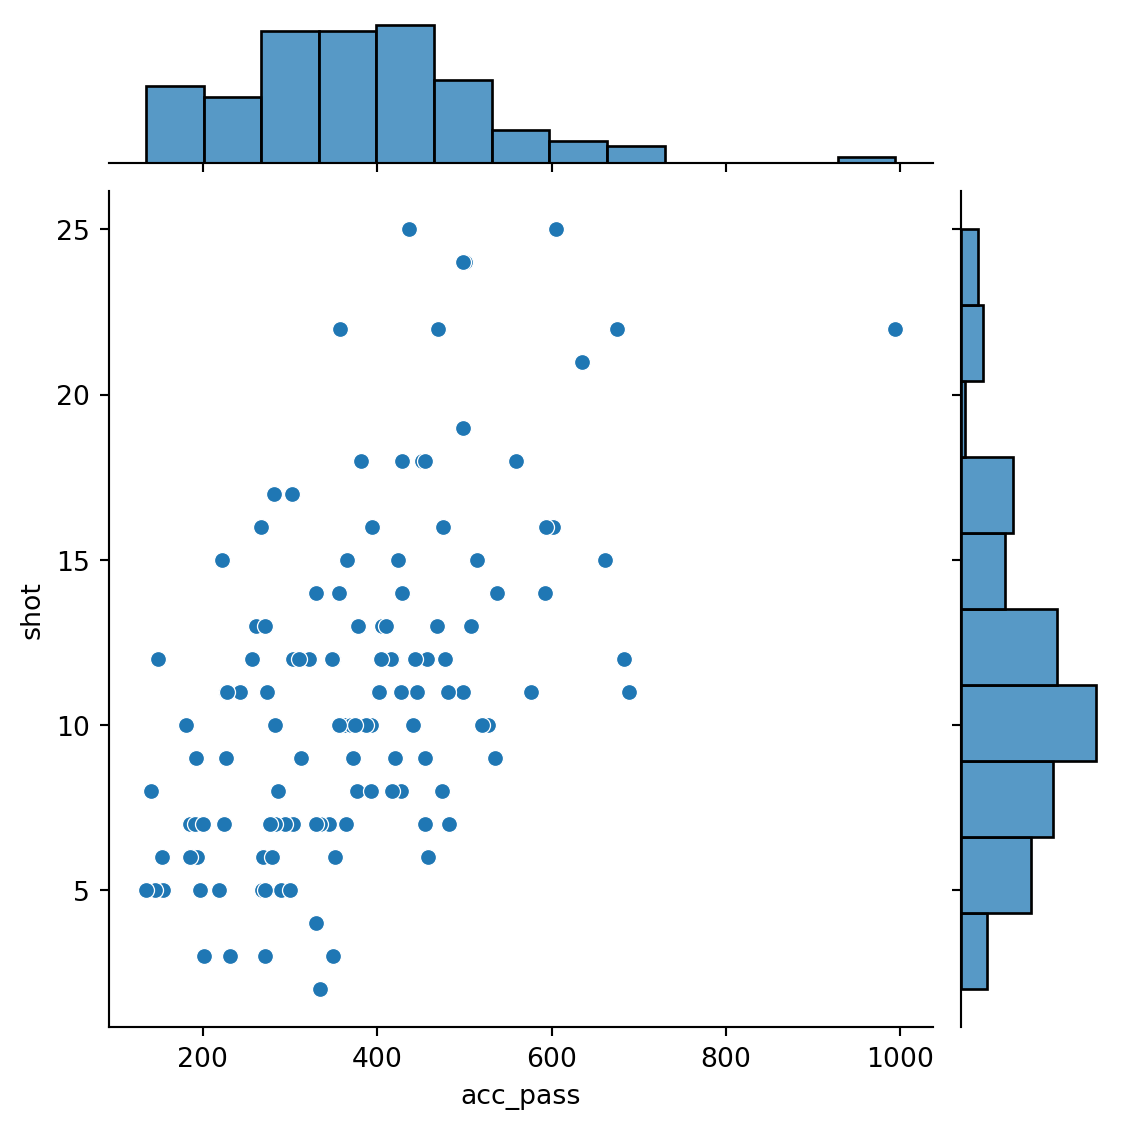
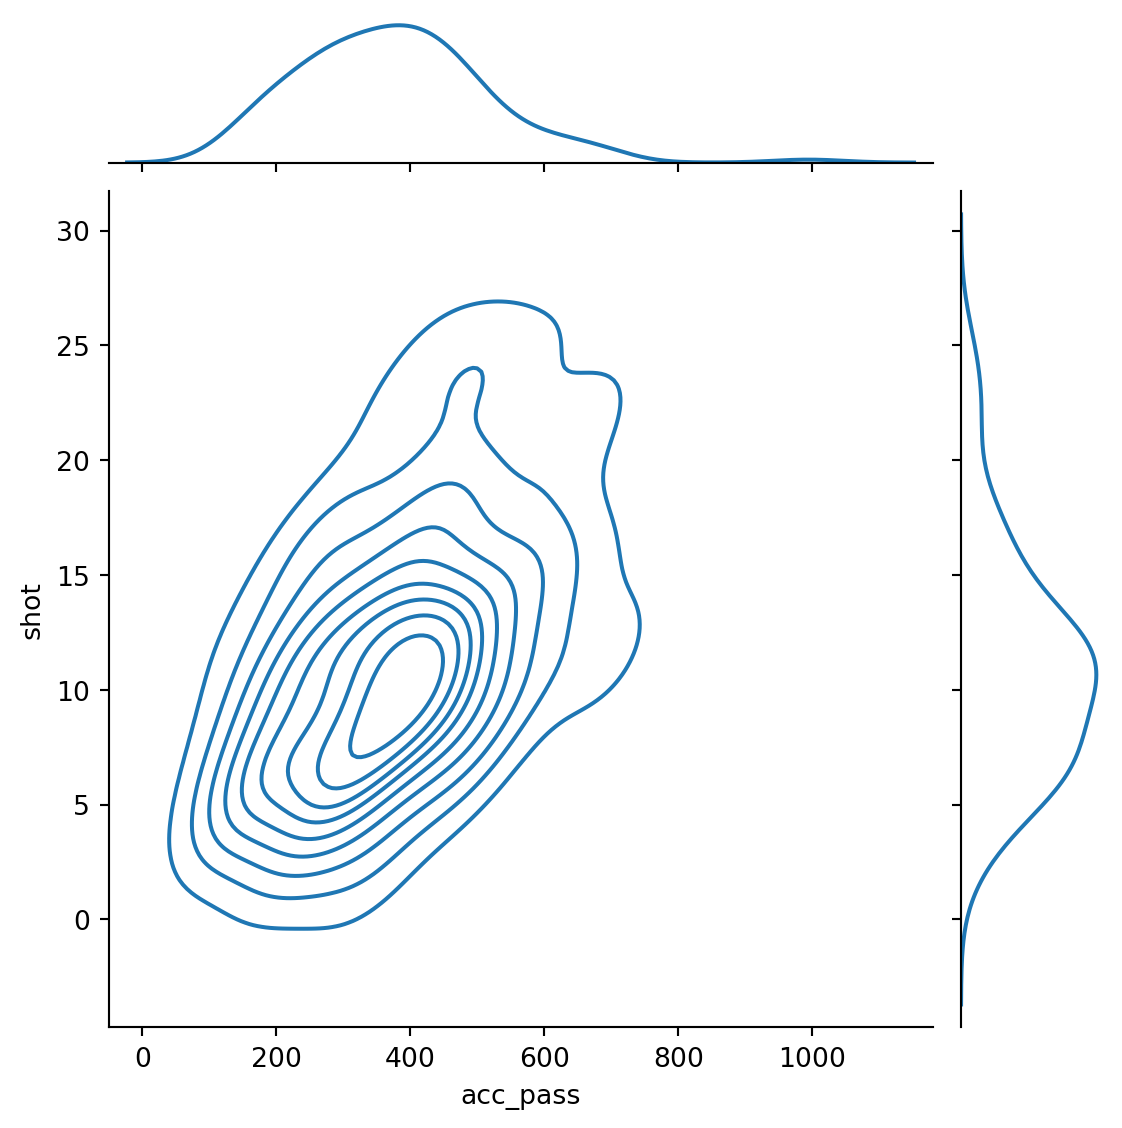
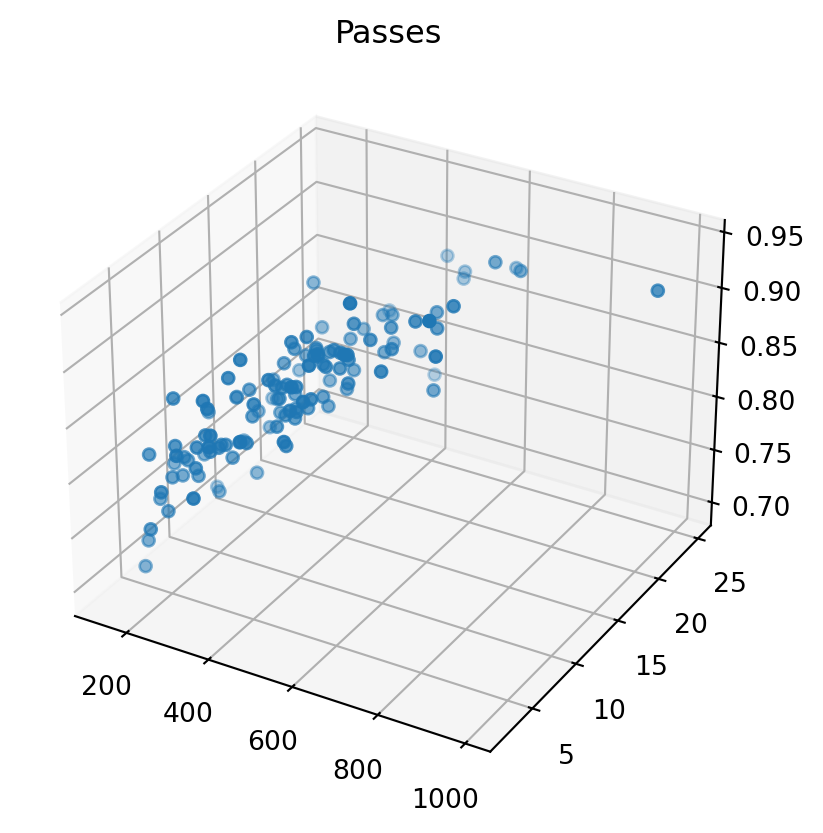
Okay, now let’s have a look at some of the passing.