import pandas as pd
import numpy as np
import matplotlib.pyplot as plt
import seaborn as sns

# Load the penguins dataset
url = "https://raw.githubusercontent.com/dataprofessor/data/refs/heads/master/penguins_cleaned.csv"
df = pd.read_csv(url)12.2 ANOVA
Bivariate C2N Statistics
What is ANOVA?
ANOVA (Analysis of Variance) is a statistical test used to determine if there are significant differences between the means of three or more groups. While a t-test compares two groups, ANOVA extends this comparison to multiple groups simultaneously.
When to Use ANOVA
Use ANOVA when: - You have one categorical variable with 3 or more categories - You have one continuous numeric variable - You want to test if at least one group mean differs from the others
ANOVA Output
ANOVA produces two key values:
- F-statistic: A value ranging from 0 to +∞
- Always positive
- Larger values indicate greater differences between group means
- Compares the variance between groups to the variance within groups
- p-value: The probability of observing this F-statistic by chance alone
- p < 0.05: At least one group mean is significantly different
- p ≥ 0.05: No significant differences detected between groups
Important Limitation
ANOVA tells you IF there’s a difference, but not WHERE the difference is. If ANOVA indicates significance, you need a post-hoc test (like Tukey’s HSD) to identify which specific groups differ from each other.
Visualizing Multiple Groups
Let’s visualize body mass across different penguin species:
plt.figure(figsize=(10, 6))
sns.kdeplot(data=df, x='body_mass_g', hue='species', fill=True, alpha=0.5, palette='Set2')
plt.title('Penguin Body Mass by Species', fontsize=14)
plt.xlabel('Body Mass (g)')
plt.ylabel('Density')
plt.legend(title='Species')
plt.show()
/tmp/ipykernel_1100241/2626565588.py:6: UserWarning: No artists with labels found to put in legend. Note that artists whose label start with an underscore are ignored when legend() is called with no argument.
plt.legend(title='Species')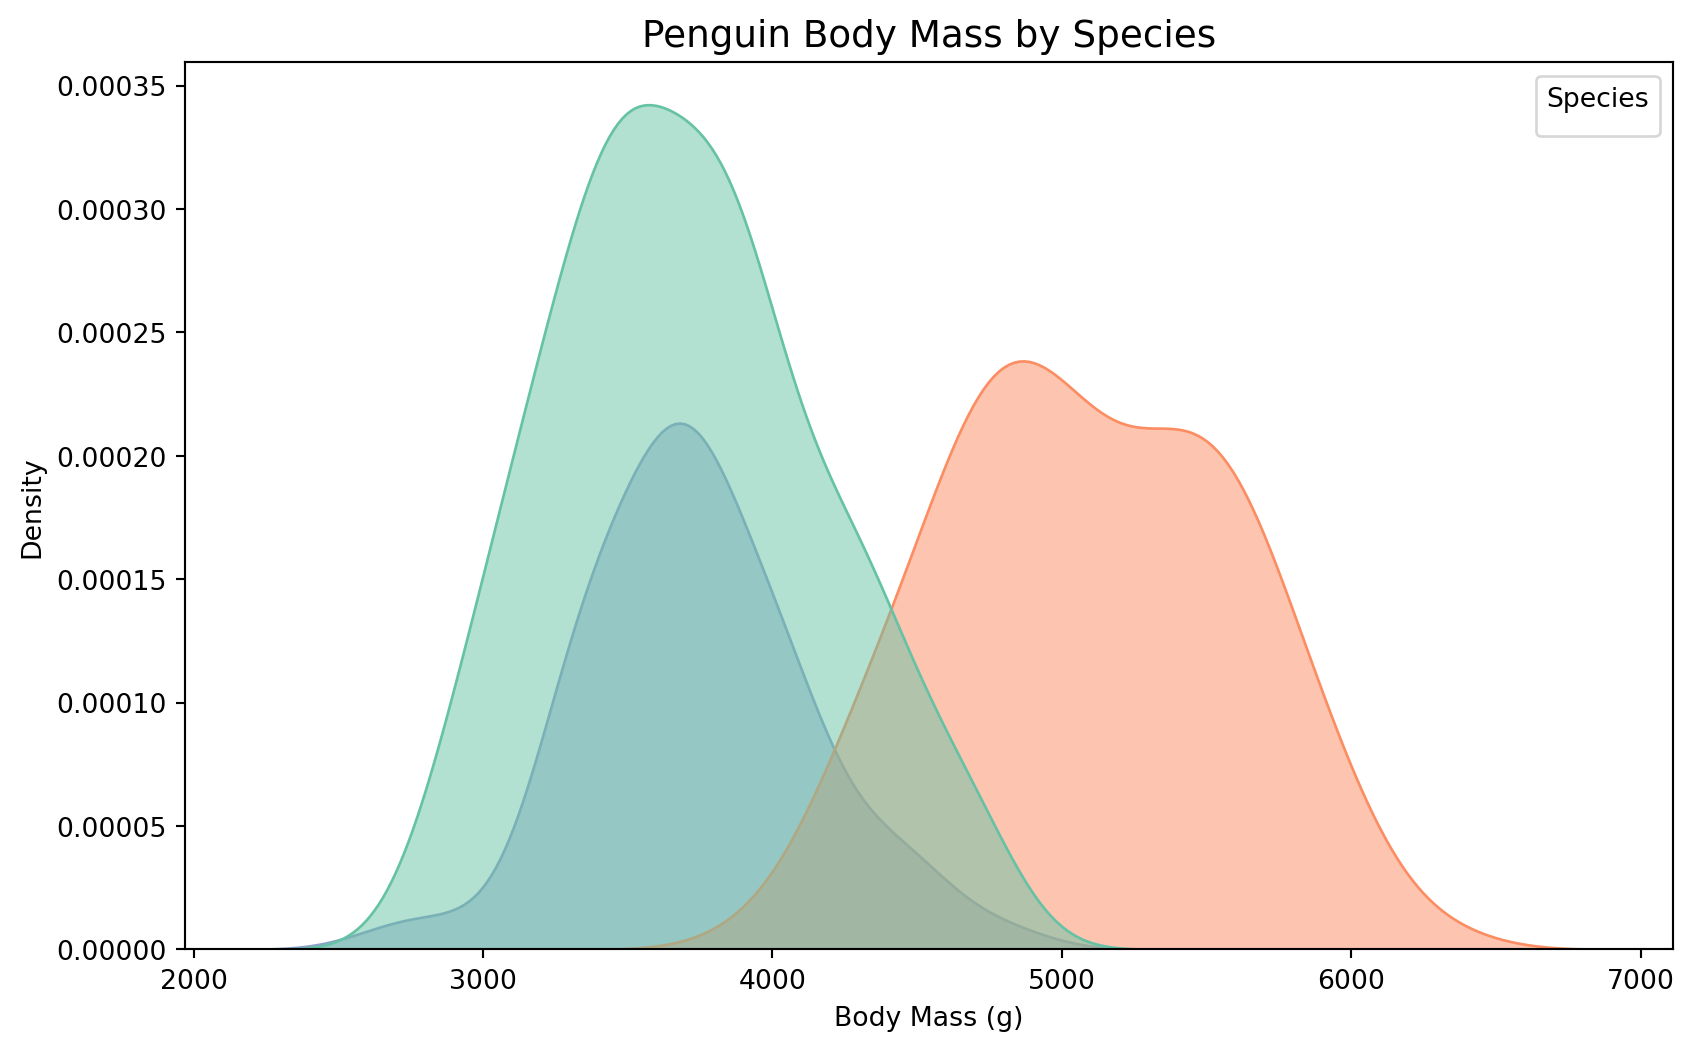
This KDE plot shows the distribution of body mass across three penguin species. We can see clear visual differences, especially for Gentoo penguins. But are these differences statistically significant?
Performing ANOVA in Python
We use scipy.stats.f_oneway() to perform a one-way ANOVA:
import scipy.stats as stats

# Separate body mass by species
adelie = df.loc[df["species"] == "Adelie", "body_mass_g"]
chinstrap = df.loc[df["species"] == "Chinstrap", "body_mass_g"]
gentoo = df.loc[df["species"] == "Gentoo", "body_mass_g"]

# Perform ANOVA
f_result = stats.f_oneway(adelie, chinstrap, gentoo)

print(f_result)
print(f"\nF-statistic: {f_result.statistic:.4f}")
print(f"p-value: {f_result.pvalue:.4f}")
F_onewayResult(statistic=np.float64(341.8948949481461), pvalue=np.float64(3.74450512630046e-81))
F-statistic: 341.8949
p-value: 0.0000A More Efficient Approach
Instead of manually creating each group, we can use list comprehension:
import scipy.stats as stats

# Get unique species values
print("Unique species:", df["species"].unique())

# Create groups using list comprehension
groups = [df.loc[df["species"] == s, "body_mass_g"] for s in df["species"].unique()]

# Unpack and perform ANOVA
f, p = stats.f_oneway(*groups)

print(f"\nF-statistic: {f:.4f}")
print(f"p-value: {p:.4f}")
Unique species: ['Adelie' 'Gentoo' 'Chinstrap']
F-statistic: 341.8949
p-value: 0.0000Interpreting the Results
- The F-statistic is very large (likely > 100), indicating substantial differences between groups
- The p-value is extremely small (likely < 0.001), far below 0.05
- We reject the null hypothesis: There are significant differences in body mass across penguin species
Critical F-Value
Similar to the critical t-value, we can determine statistical significance by comparing our F-statistic to a critical F-value.
Calculating the Critical F-Value
The critical F-value depends on: 1. Degrees of freedom between groups (dfb): number of categories - 1 2. Degrees of freedom within groups (dfw): total observations - number of categories 3. Significance level (α): Typically 0.05
import scipy.stats as stats

# Calculate degrees of freedom
dfb = len(df["species"].unique()) - 1  # between groups
dfw = df["species"].count() - len(df["species"].unique())  # within groups

print(f"Degrees of freedom between groups: {dfb}")
print(f"Degrees of freedom within groups: {dfw}")

# Significance level
alpha = 0.05

# Calculate critical F-value
f_critical = stats.f.ppf(1 - alpha, dfb, dfw)

print(f"\nCritical F-value: {f_critical:.4f}")
Degrees of freedom between groups: 2
Degrees of freedom within groups: 330
Critical F-value: 3.0231Now we can compare our critical F-value against our observed F-statistic. If the F-statistic is greater than the critical F-value, we reject the null hypothesis. Our critical F-value (3.0231) is less than our observed F-statistic (341.8949). Since the null hypothesis predicts no difference between group means, rejecting it means at least one species’ mean body mass differs significantly from the others.
Because the observed F-statistic exceeds the critical F-value, we reject the null hypothesis. This confirms the p-value interpretation: there are statistically significant differences in body mass across penguin species. Identifying which species differ requires a post-hoc test (e.g., Tukey’s HSD).
Summary
ANOVA allows us to:
- Compare means across three or more groups
- Test if any group differs significantly from the others
- Extend t-test logic to multiple groups
Key takeaways:
- Use
scipy.stats.f_oneway()for one-way ANOVA - Check the p-value against α = 0.05
- Or compare F to the critical F-value
- If significant, use post-hoc tests (like Tukey’s HSD) to identify which groups differ
- ANOVA answers “Is there a difference?” but not “Where is the difference?”