For this project, let’s begin to work with some soccer data from the 2018 World Cup. This data is availailable on github, and we can read it directly into a pandas DataFrame.
First let’s import the necessary libraries, and read the data. to look at it.
import pandas as pdimport numpy as npimport matplotlib.pyplot as pltimport seaborn as snsurl ="https://raw.githubusercontent.com/nkmwicz/worldcup2018data/refs/heads/main/cleaned_events_world_cup2018.csv"df = pd.read_csv(url)df.head()
eventId
subEventName
tags
playerId
matchId
eventName
teamId
matchPeriod
eventSec
subEventId
id
x1
y1
x2
y2
0
8
Simple pass
['Accurate']
Mohammad Ibrahim Al Sahlawi
Russia - Saudi Arabia, 5 - 0
Pass
Saudi Arabia
1H
1.656214
Simple pass
258612104
50
50
35.0
53.0
1
8
High pass
['Accurate']
Abdullah Ibrahim Otayf
Russia - Saudi Arabia, 5 - 0
Pass
Saudi Arabia
1H
4.487814
High pass
258612106
35
53
75.0
19.0
2
1
Air duel
['Won', 'Accurate']
Ilya Kutepov
Russia - Saudi Arabia, 5 - 0
Duel
Russia
1H
5.937411
Air duel
258612077
25
81
37.0
83.0
3
1
Air duel
['Lost', 'Not accurate']
Yasir Gharsan Al Shahrani
Russia - Saudi Arabia, 5 - 0
Duel
Saudi Arabia
1H
6.406961
Air duel
258612112
75
19
63.0
17.0
4
8
Simple pass
['Accurate']
Salman Mohammed Al Faraj
Russia - Saudi Arabia, 5 - 0
Pass
Saudi Arabia
1H
8.562167
Simple pass
258612110
63
17
71.0
15.0
First, this data is event-level data, meaning each row is a single event that happened in a match. Events include passes, shots, fouls, etc. Each event has a matchId and a teamId to indicate which match and team the event belongs to. The important columns for us are eventName, which tells us what type of event it is, and tags, which is a list of tags that give more information about the event. For example, a shot event may have a tag indicating whether or not it was a goal. Unfortunately, however, this data comes from a csv file, so the tags column is a string representation of a list. We can use the ast.literal_eval function to convert this string representation back into a list.
import ast # for literal_eval of the tags columndf["tags"] = df["tags"].apply(ast.literal_eval)
Now, let’s look at the available data in the eventName column. We can do that by using the unique() function.
df["eventName"].unique()
array(['Pass', 'Duel', 'Free Kick', 'Foul', 'Others on the ball', 'Shot',
       'Save attempt', 'Offside', 'Goalkeeper leaving line'], dtype=object)
We can see that there are a variety of event types. For this project, let’s focus on passes, shots, and goals. We can create new columns in the DataFrame to indicate whether or not each event is a pass, shot, or goal. But the question is how do we identify goals? There is not a goal event type. Let’s look at the tags for a possible answer. The problem is that tags are a list, so .unique() won’t work here. It will not check inside the lists. Instead, we need to flatten the list of lists into a single list. We can do that with a list comprehension. To explain a nested list comprehension, I like to first create the full loop:
all_tags = []for sublist in df["tags"]:for tag in sublist: all_tags.append(tag)
Here we can see we need two sequential for loops to get each tag from each sublist. To convert this code into a list comprehension, we just need to put the tag variable at the front, and then line up the second for loop after the first. This gives us:
all_tags = [tag for sublist in df["tags"] for tag in sublist]unique_tags =list(set(all_tags)) # remove duplicatesunique_tags.sort() # sorts the list in placeunique_tags
['Accurate',
 'Anticipated',
 'Anticipation',
 'Assist',
 'Blocked',
 'Counter attack',
 'Dangerous ball lost',
 'Direct',
 'Fairplay',
 'Feint',
 'Free space left',
 'Free space right',
 'Goal',
 'Head/body',
 'High',
 'Indirect',
 'Interception',
 'Key pass',
 'Left foot',
 'Lost',
 'Missed ball',
 'Neutral',
 'Not accurate',
 'Opportunity',
 'Own goal',
 'Position: Goal center',
 'Position: Goal center left',
 'Position: Goal center right',
 'Position: Goal high center',
 'Position: Goal high left',
 'Position: Goal high right',
 'Position: Goal low center',
 'Position: Goal low left',
 'Position: Goal low right',
 'Position: Out center left',
 'Position: Out center right',
 'Position: Out high center',
 'Position: Out high left',
 'Position: Out high right',
 'Position: Out low left',
 'Position: Out low right',
 'Position: Post center left',
 'Position: Post center right',
 'Position: Post high center',
 'Position: Post high left',
 'Position: Post high right',
 'Position: Post low left',
 'Position: Post low right',
 'Red card',
 'Right foot',
 'Second yellow card',
 'Sliding tackle',
 'Take on left',
 'Take on right',
 'Through',
 'Won',
 'Yellow card']
We can see that Goal exists in the tags, so we can use that to identify goals.
Now let’s create a few new columns to indicate whether or not each event is a pass, shot, or goal. We can either use boolean indexing or the apply() function. Here, I’ll use a combination of both.
Now that we have these columns we can, let’s group the data by matchId and teamId. We can use the sum aggregation function to get the total number of passes, shots, and goals for each team in each match. This works because we created binary columns where 1 indicates the event happened, and 0 indicates it did not. Pandas recognized that our new columns are booleans, so when we used .astype(int), we converted them to 0s and 1s. Therefore, summing these columns gives us the total number of each event type.
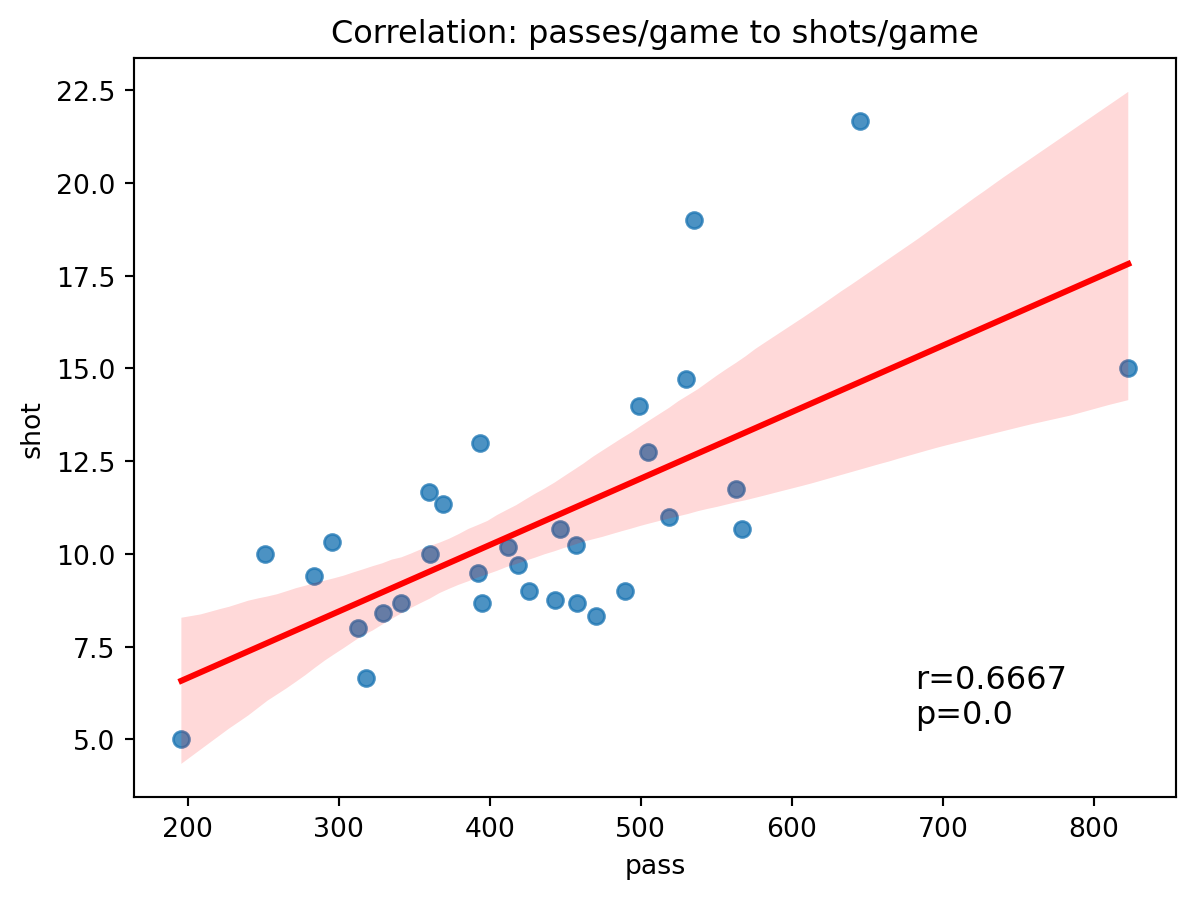
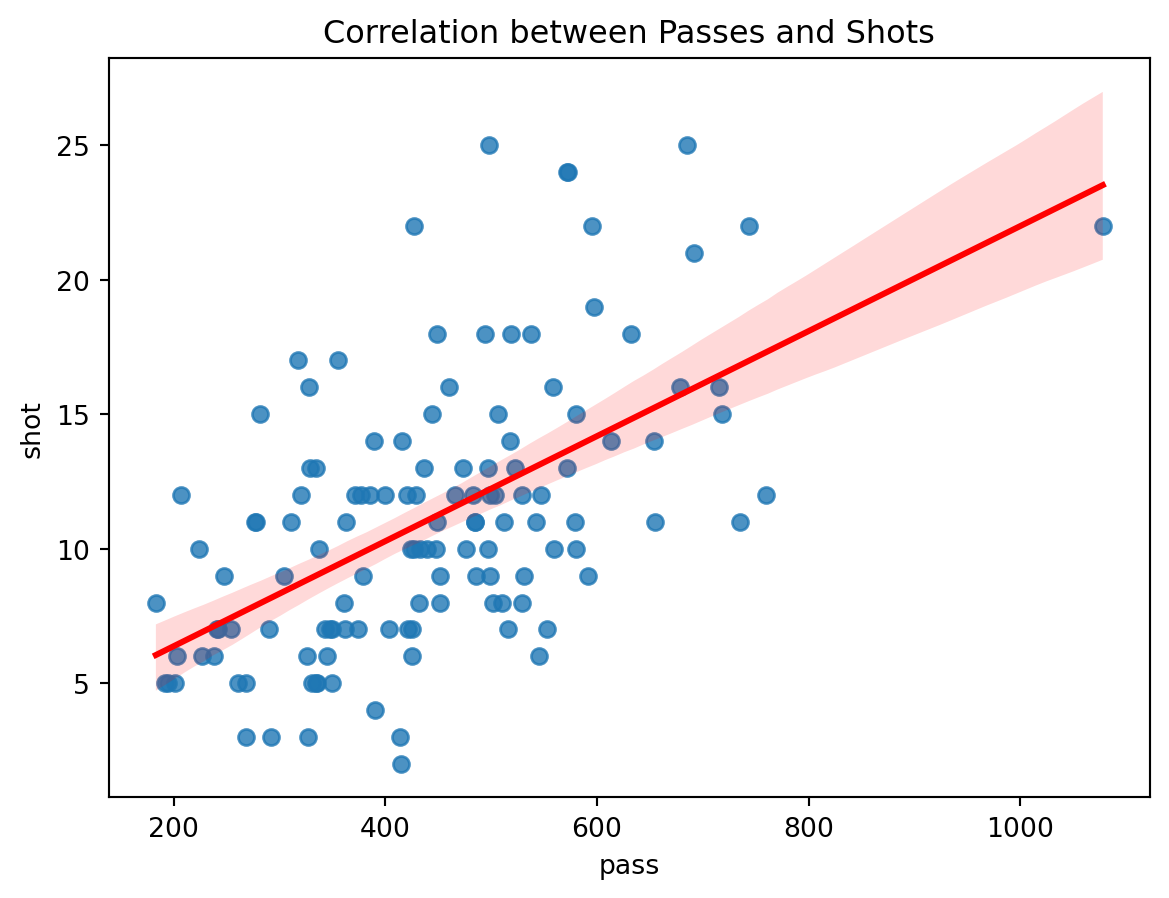
Now that we have the stats, we can begin to check the correlation.
team_stats.corr(numeric_only=True)
matchId
pass
goal
shot
matchId
1.000000
0.242743
0.673839
0.260202
pass
0.242743
1.000000
0.427120
0.666682
goal
0.673839
0.427120
1.000000
0.360757
shot
0.260202
0.666682
0.360757
1.000000
from scipy.stats import pearsonrfor col in team_stats.columns:if pd.api.types.is_numeric_dtype(team_stats[col]): r, p = pearsonr(team_stats["pass"], team_stats[col])print(f"pass to {col}--r: {r}, p: {round(p, 4)}")
pass to matchId--r: 0.24274261628733085, p: 0.1807
pass to pass--r: 1.0, p: 0.0
pass to goal--r: 0.42711954522711015, p: 0.0148
pass to shot--r: 0.666682272587523, p: 0.0