11.3 Scatter Plots and More

Bivariate N2N Visualizations

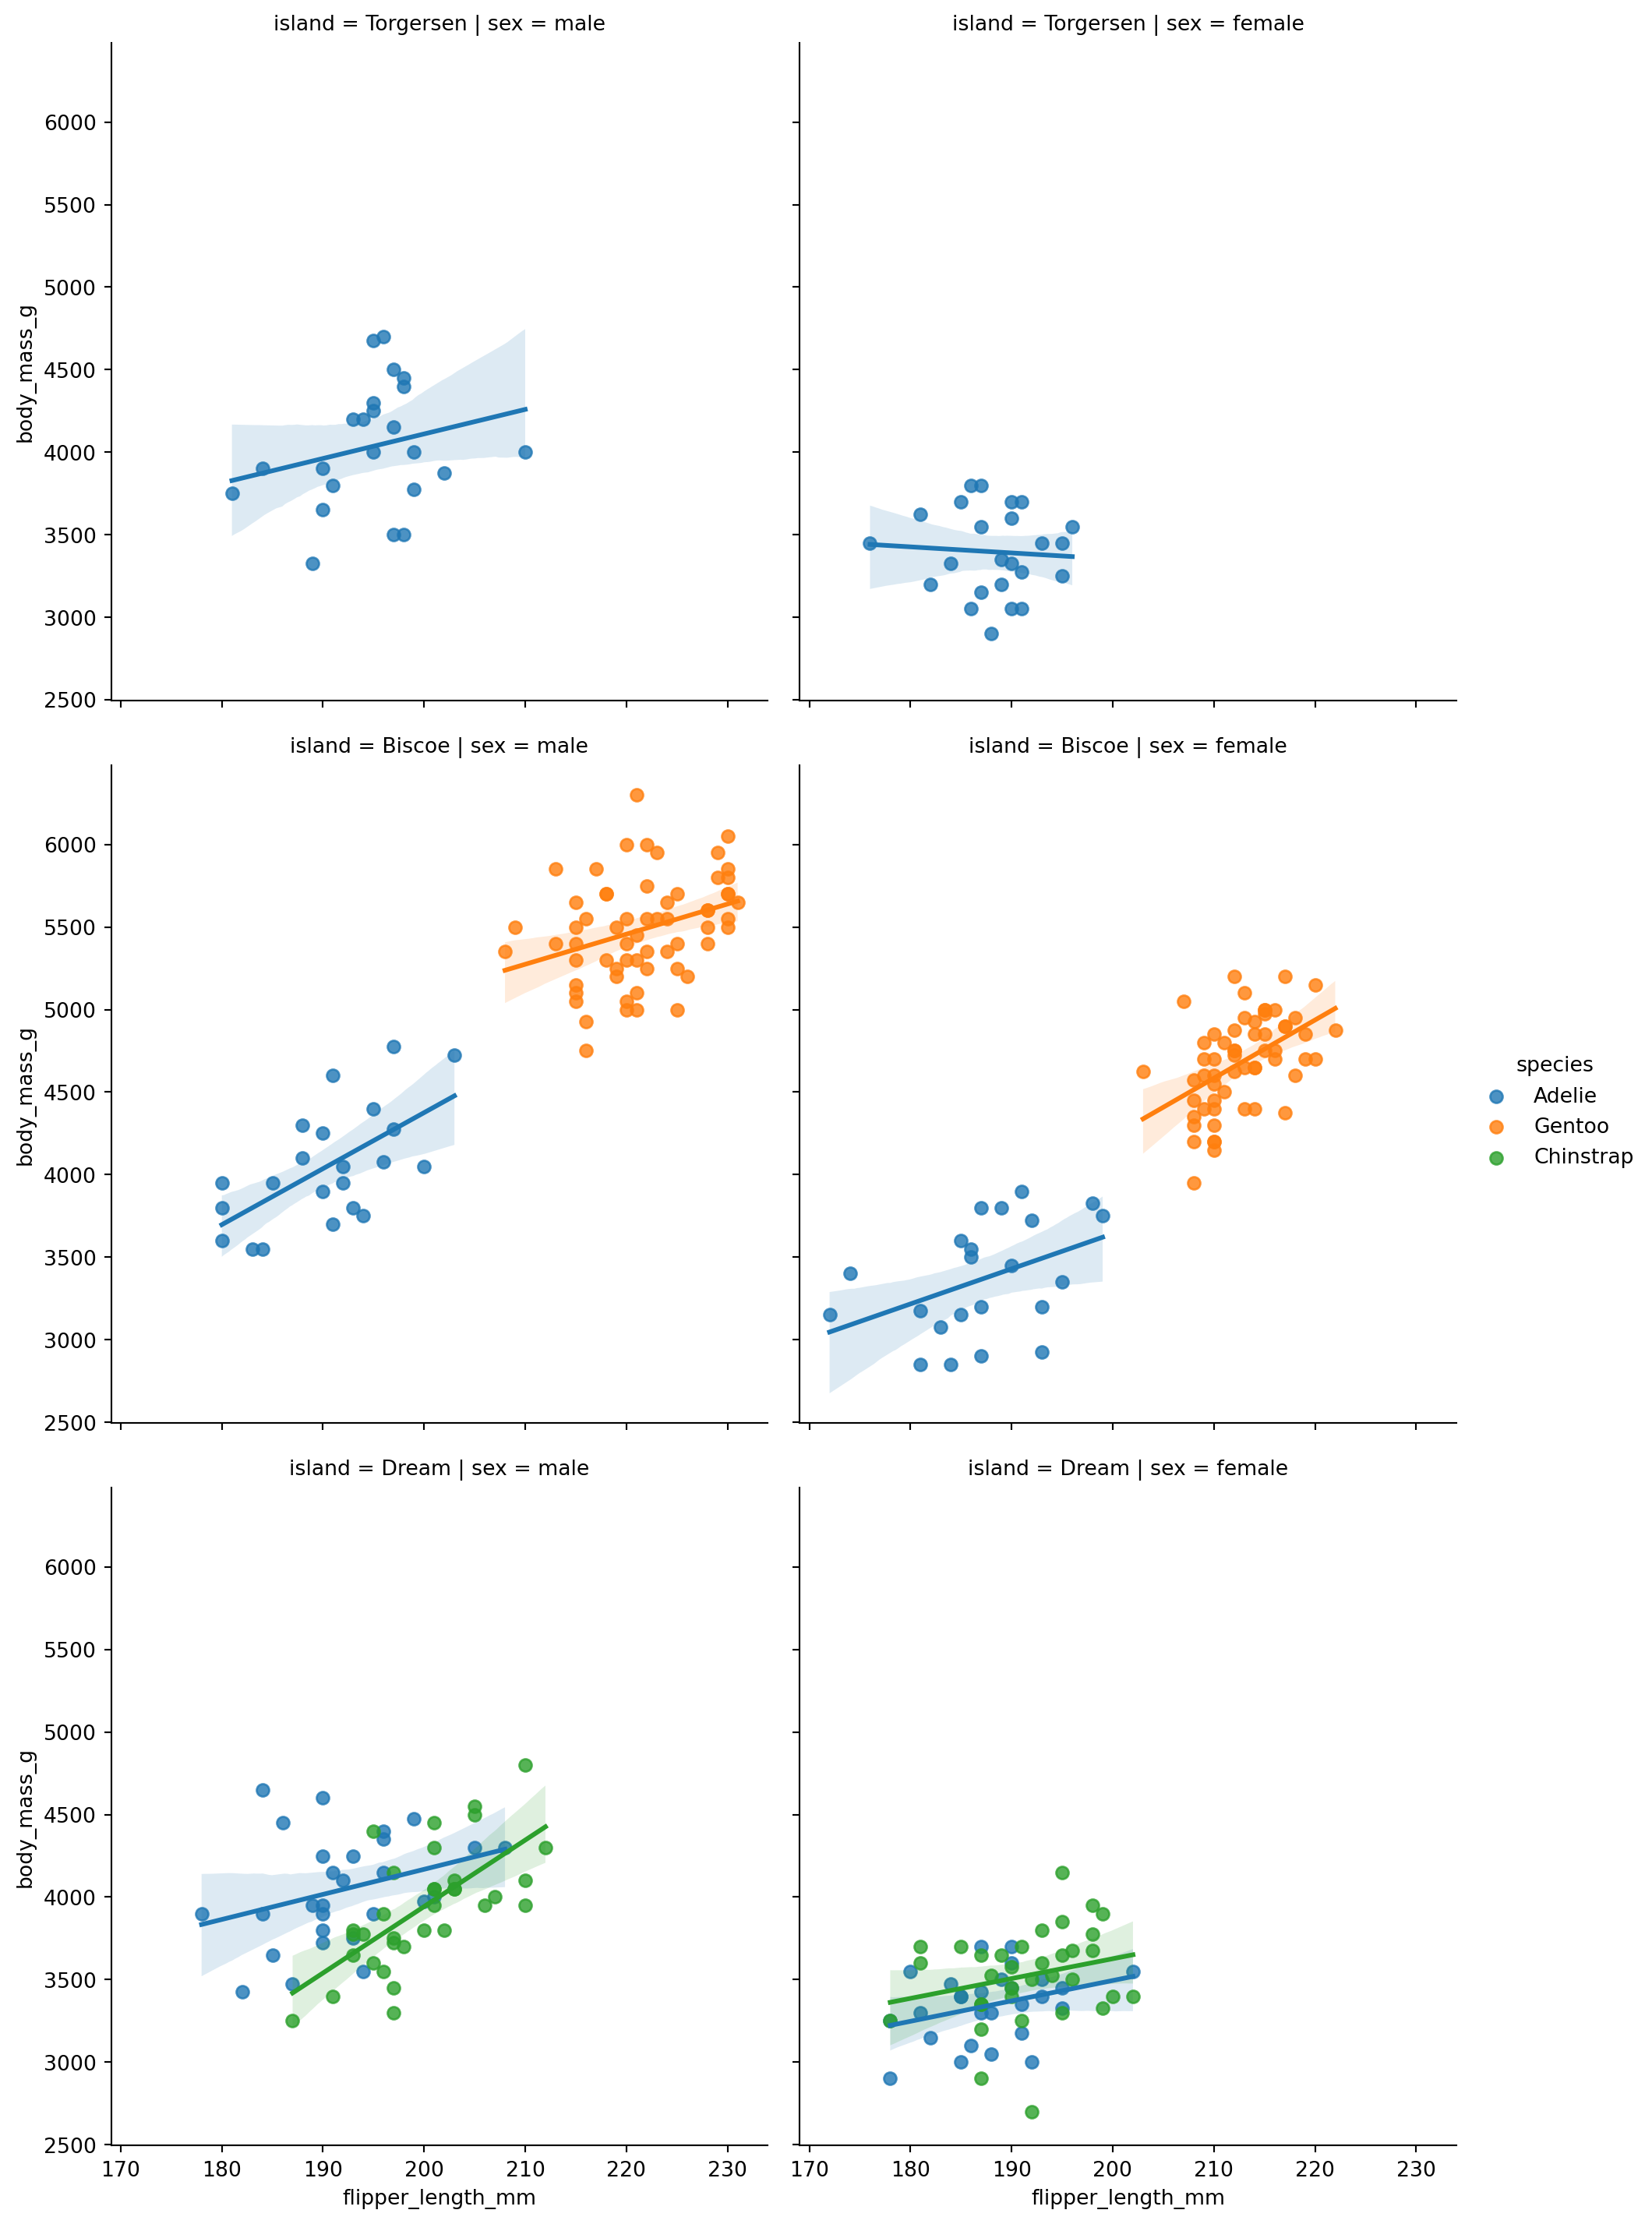
We can also create scatter plots combined with other plots. One of the easiest ways to do this is the lmplot method from seaborn, we can use it to create multiple plots with regression lines.

import pandas as pd
import matplotlib.pyplot as plt
import seaborn as sns

url = "https://raw.githubusercontent.com/dataprofessor/data/refs/heads/master/penguins_cleaned.csv"
penguins = pd.read_csv(url)
penguins.head()
species island bill_length_mm bill_depth_mm flipper_length_mm body_mass_g sex
0 Adelie Torgersen 39.1 18.7 181 3750 male
1 Adelie Torgersen 39.5 17.4 186 3800 female
2 Adelie Torgersen 40.3 18.0 195 3250 female
3 Adelie Torgersen 36.7 19.3 193 3450 female
4 Adelie Torgersen 39.3 20.6 190 3650 male
sns.lmplot(
    x="flipper_length_mm",
    y="body_mass_g",
    hue="species",
    data=penguins,
    col="sex",
    row="island",
)

This figure plots the different species of penguins in different colors, separated by sex (columns) and island (rows). Each subplot contains a scatter plot of flipper length vs body mass, along with a regression line for each species.

We can also create joint plots withe seaborn that combine scatter plots with histograms or density plots.
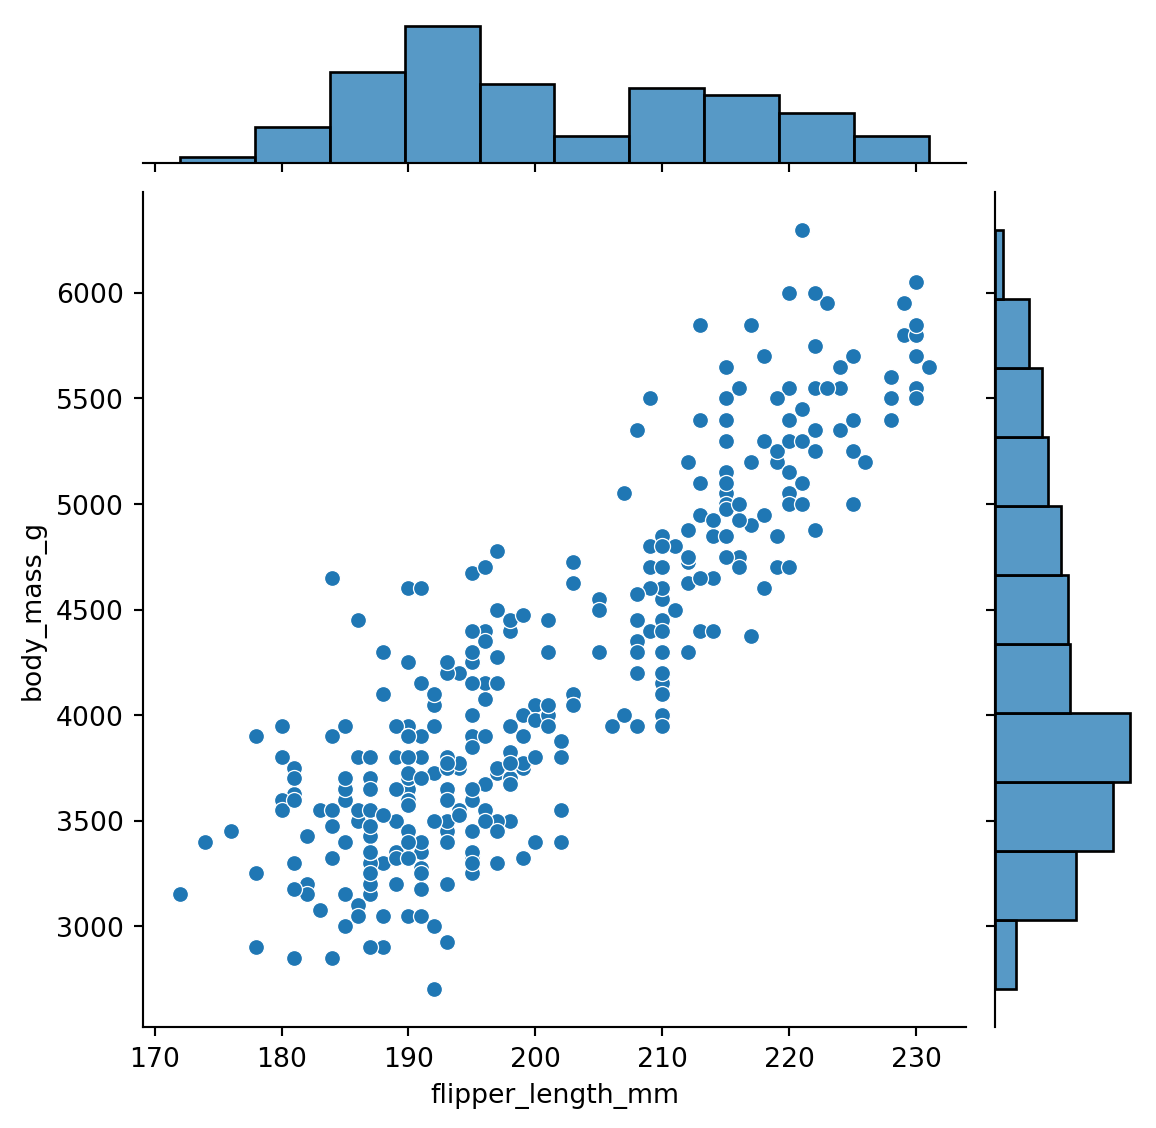
sns.jointplot(
    x="flipper_length_mm",
    y="body_mass_g",
    data=penguins,
)

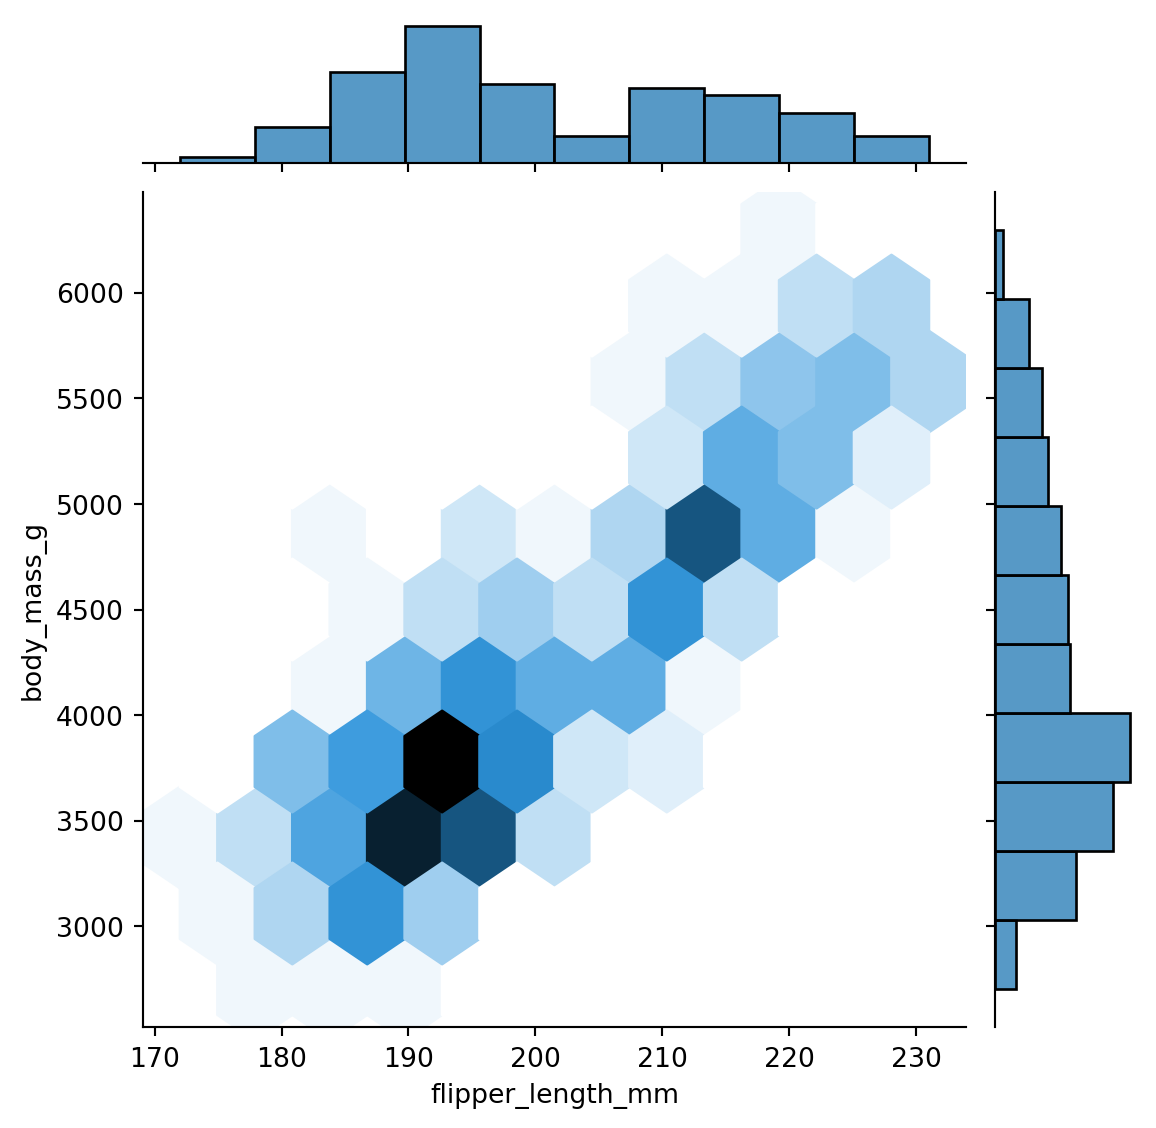
We can also change the kind of plot used in the joint plot. For example, we can use a hexbin plot to visualize the density of points.

sns.jointplot(
    x="flipper_length_mm",
    y="body_mass_g",
    data=penguins,
    kind="hex",
)

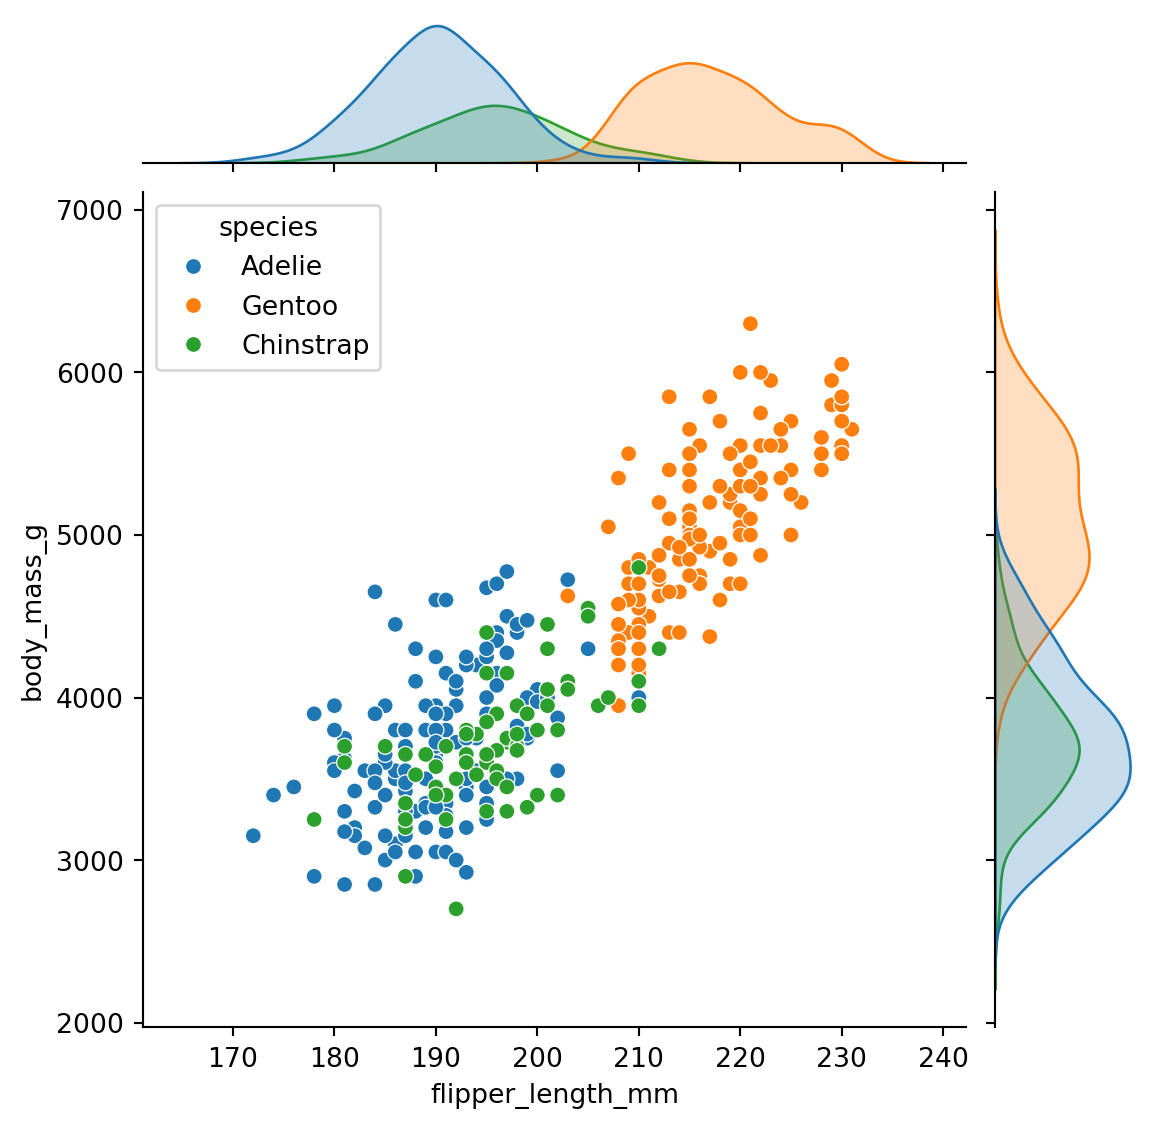
We can also color the points by species using the hue parameter.

sns.jointplot(
    x="flipper_length_mm",
    y="body_mass_g",
    data=penguins,
    kind="scatter",
    hue="species",
)

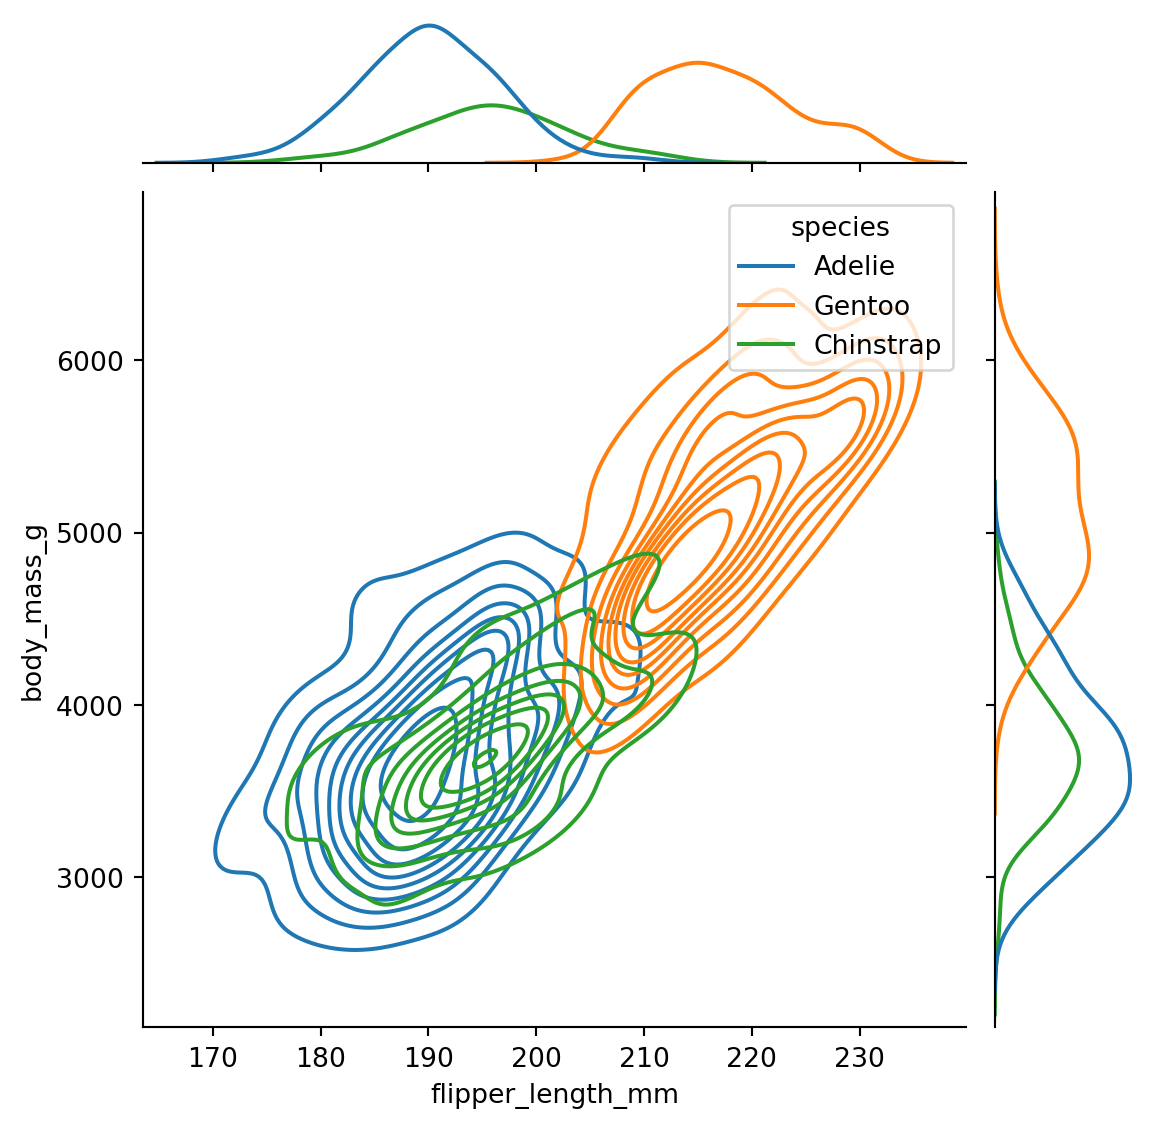
Finally, we can create a kernel density estimate (KDE) plot to visualize the distribution of points.

sns.jointplot(
    x="flipper_length_mm",
    y="body_mass_g",
    data=penguins,
    kind="kde",
    hue="species",
)