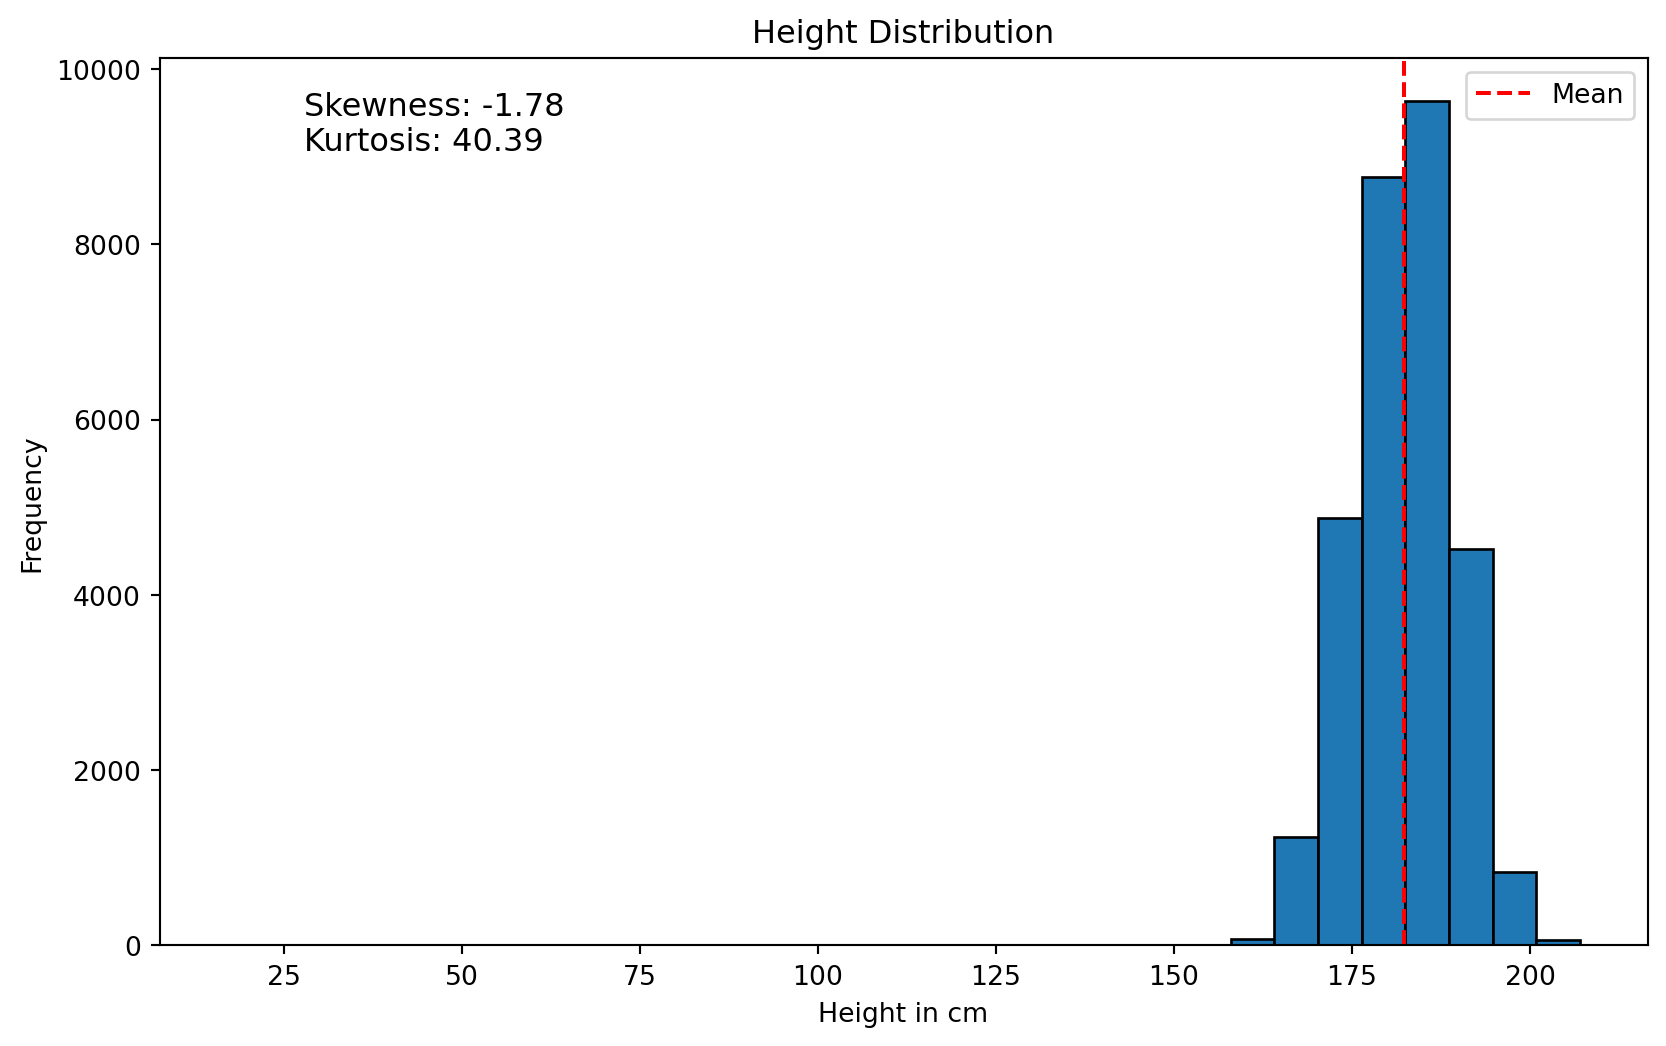
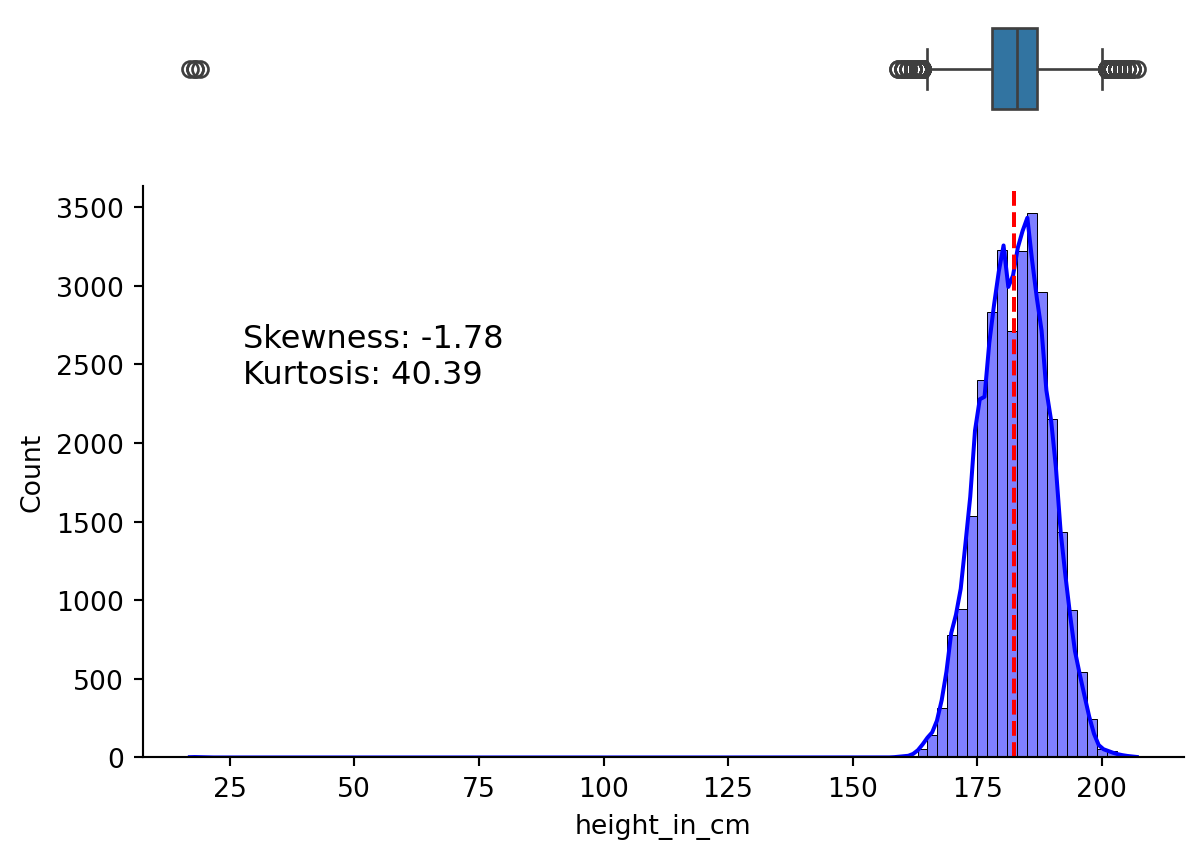
Let’s start by understanding the distribution of heights in the dataset. The first way to look at this is by using a histogram. Let’s start by creating the histogram in matplotlib.
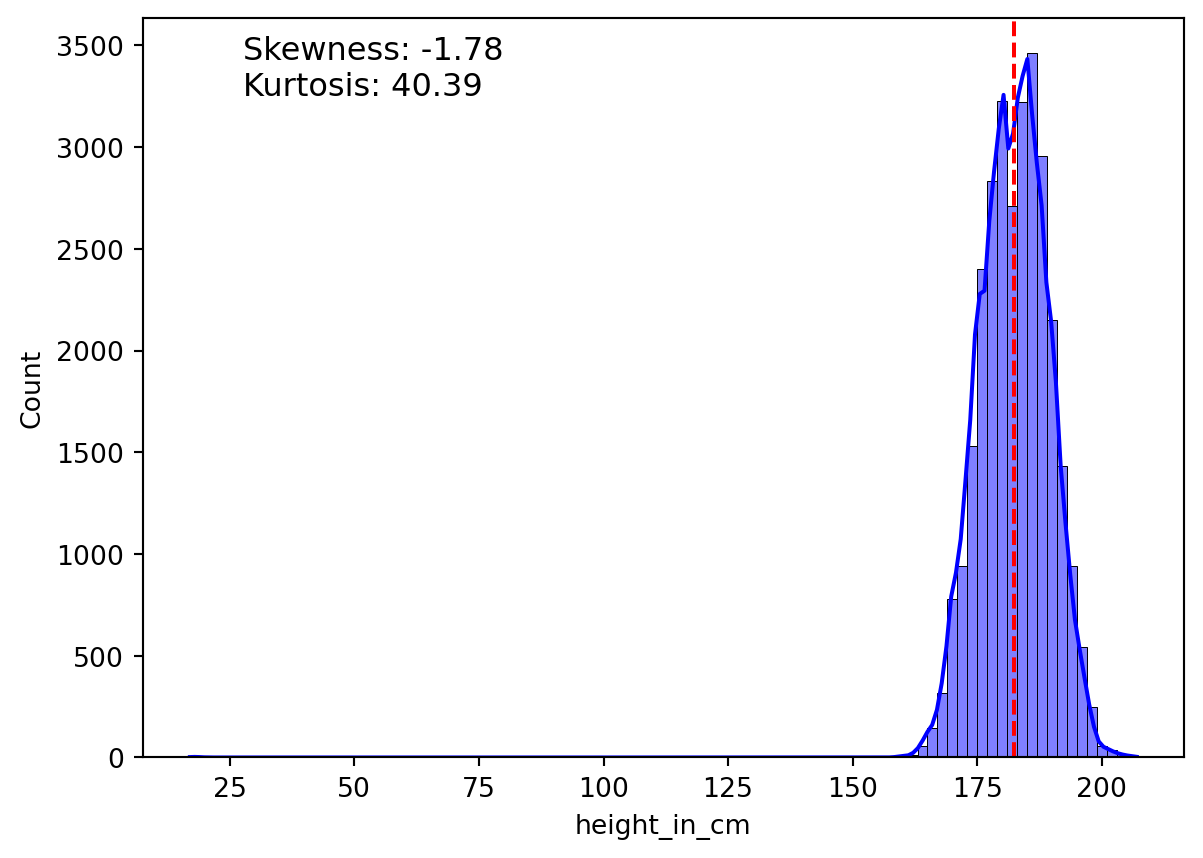
Seaborn makes it much easier by abstracting away much of the calculations. For instance, it creates the Kernel Density Estimation (KDE) plot by default. The KDE plot provides a smoothed estimation of the distribution of the data.
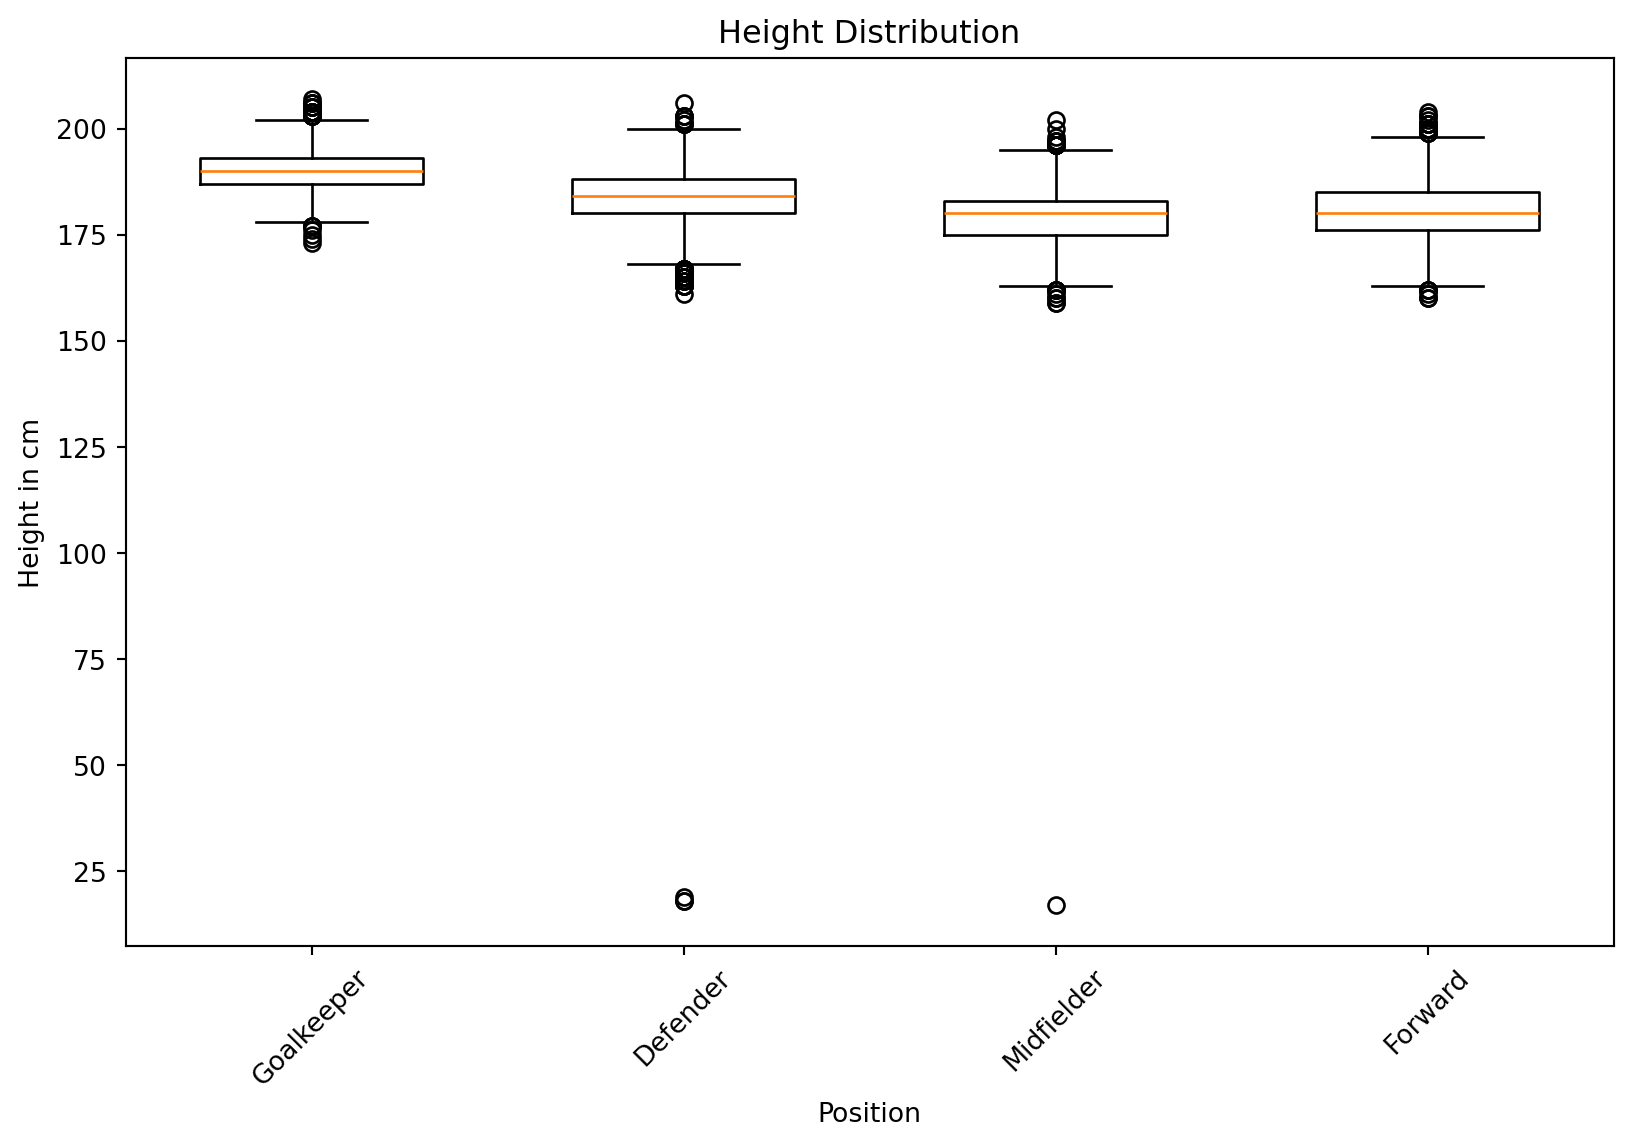
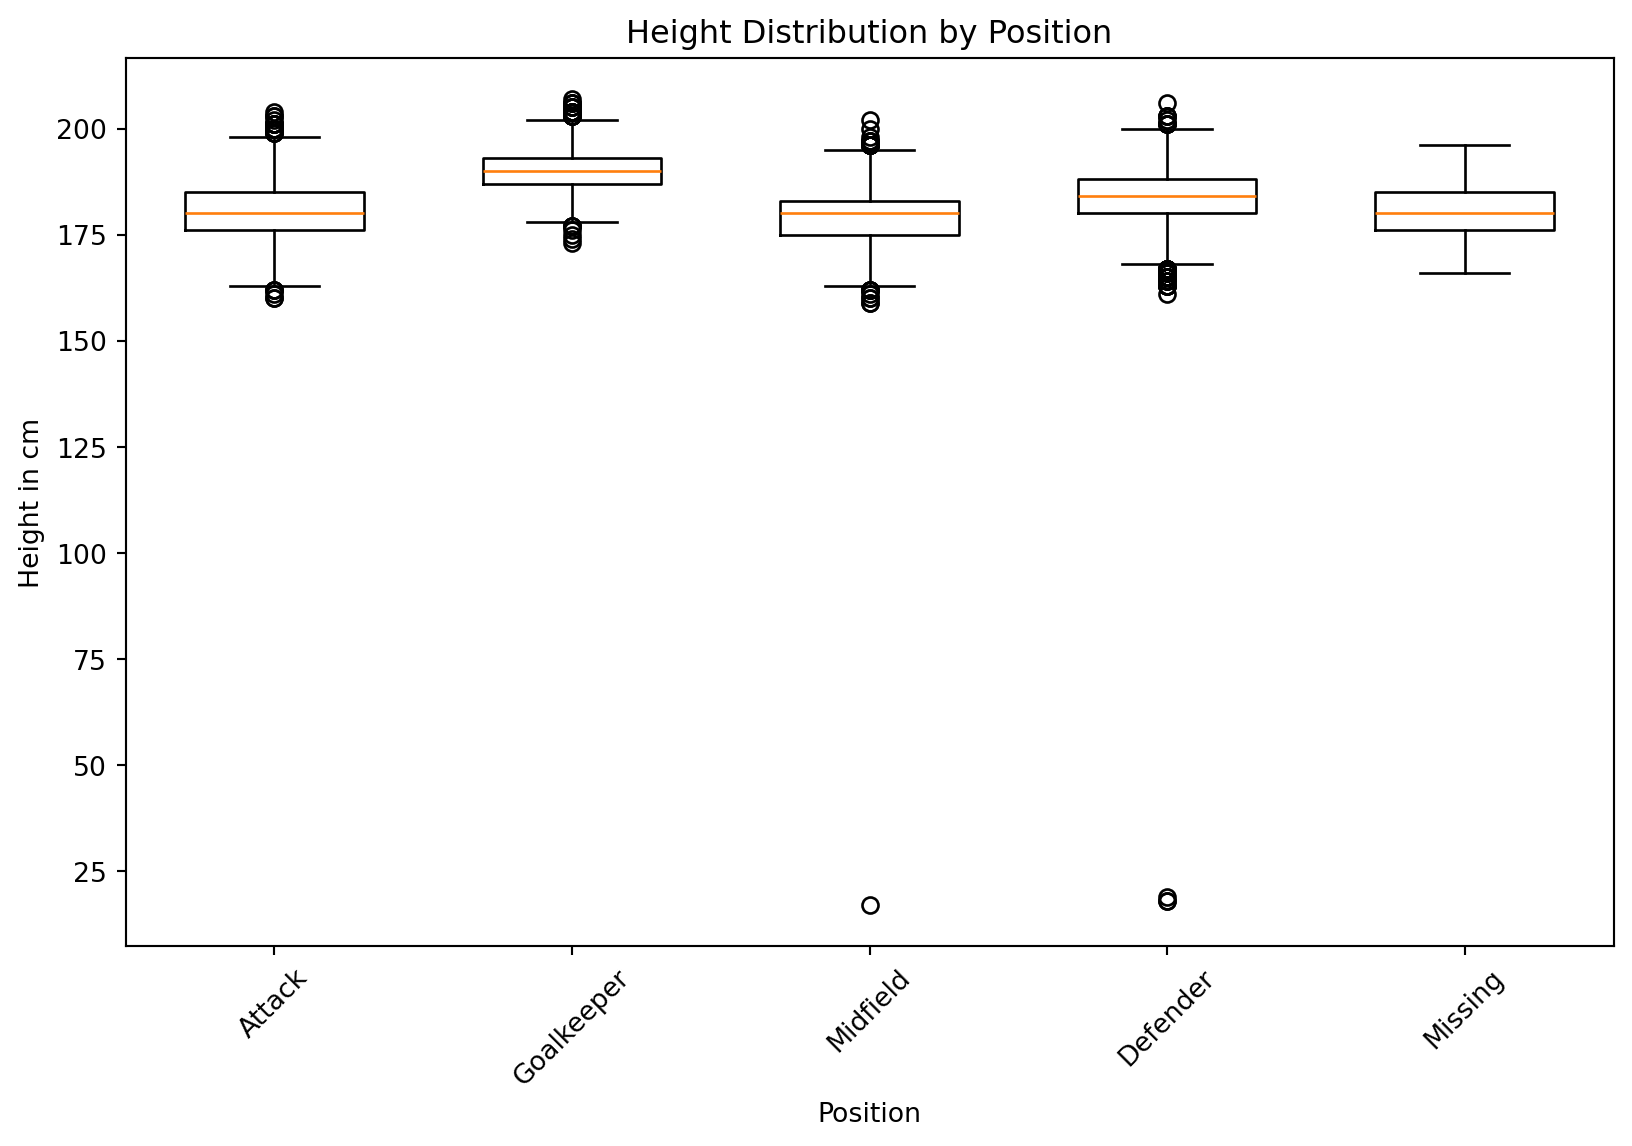
Now let’s create a box plot, but let’s first do it with matplotlib.
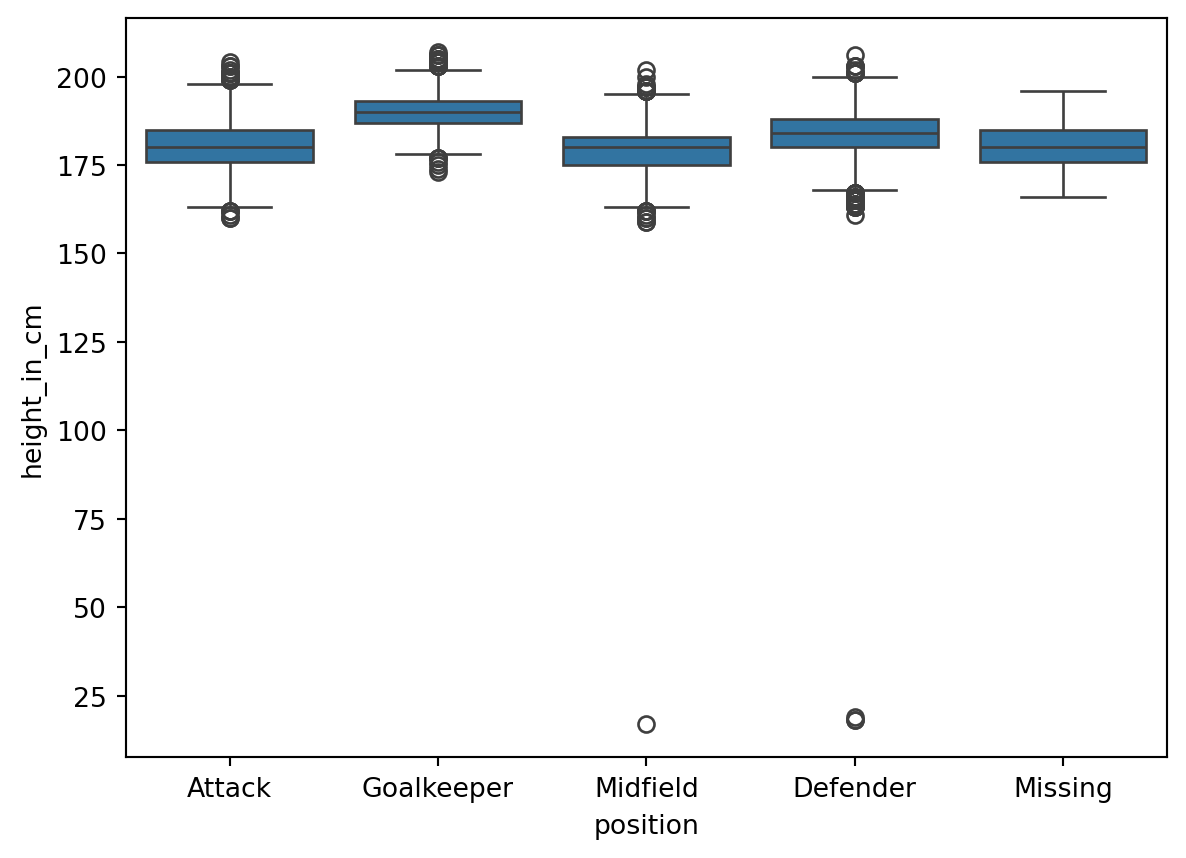
Now let’s remember that the box plot represents the interquartile range (IQR), or the middle 50% of the data. The bottom of the box is the 25th percentile, the line in the middle is the median, and the top of the box is the 75th percentile. The whiskers represent the range of the data, and the points are outliers. Whiskers extend to the most extreme data points within 1.5 times the IQR from the box.
To do this same thing in matplotlib, we would have to do more work.
positions = df["position"].unique()plt.figure(figsize=(10, 6))for i, pos inenumerate(positions): plt.boxplot( df.loc[df["position"] == pos, "height_in_cm"], positions=[i], widths=0.6, )plt.xticks(range(len(positions)), positions, rotation=45)plt.xlabel("Position")plt.ylabel("Height in cm")plt.title("Height Distribution by Position")plt.show()
Multiple Plots
We can also create a combination of a box plot and a histogram by using the subplot function in matplotlib. We can use matplotlib’s subplot method, which permits us to create multiple plots in a single figure. It returns a figure along with a tuple including each plot. Below, I destructured the figure as f, and the tuple as plt1 and plt2.
Then, when we create our plots with seaborn, we assign the ax argument to the plot we want it to be connected to.