8.0 Univariate Statistics
The beginning of a data analytics project always begins with Exploratory Data Analysis (EDA). EDA is the process of summarizing and visualizing the important characteristics of a dataset. It is an essential step in understanding the data and identifying any potential issues or patterns that may be present. This process begins by examining and evaluating univariate statistics, which are statistics that describe a single variable.
There are three primary groups of univariate statistics: measures of central tendency, measures of dispersion, and measures of distribution shape. But what do these mean?
- Measures of Central Tendency: These statistics describe the center or typical value of a dataset. The most common measures of central tendency are the mean, median, and mode.
- Mean: The arithmetic average of a set of values, calculated by summing all the values and dividing by the number of values.
- Median: The middle value in a sorted list of values. If there is an even number of values, the median is the average of the two middle values.
- Mode: The value that appears most frequently in a dataset.
- Measures of Dispersion: These statistics describe the spread or variability of a dataset. Common measures of dispersion include range, variance, and standard deviation.
- Range: The difference between the maximum and minimum values in a dataset.
- Variance: A measure of how much the values in a dataset vary from the mean. It is calculated by taking the average of the squared differences between each value and the mean.
- Standard Deviation: The square root of the variance, representing the average amount by which values differ from the mean.
- Measures of Distribution Shape: These statistics describe the shape of the distribution of a dataset. Common measures of distribution shape include skewness and kurtosis.
- Skewness: A measure of the asymmetry of a distribution. A distribution is said to be positively skewed if it has a long tail on the right side, and negatively skewed if it has a long tail on the left side.
- Kurtosis: A measure of the “tailedness” of a distribution. A distribution with high kurtosis has heavy tails, while a distribution with low kurtosis has light tails.
In the following sections, we will explore how to calculate and interpret these univariate statistics using Python, Pandas, and Scipy. In the next chapter we will explore how we visualize these statistics using various plotting techniques.
Normal Distributions
In order to understand these characteristics, it is important to understand dataset distributions and normal distributions. This is because what we are really trying to measure with these statistics is how closely a dataset follows a normal distribution. A normal distribution, also known as a Gaussian distribution, is a probability distribution that is symmetric around the mean, with most of the data points falling within a certain range of values. A normal distribution is characterized by its bell-shaped curve, which is defined by two parameters: the mean (μ) and the standard deviation (σ). The mean represents the center of the distribution, while the standard deviation represents the spread of the distribution.
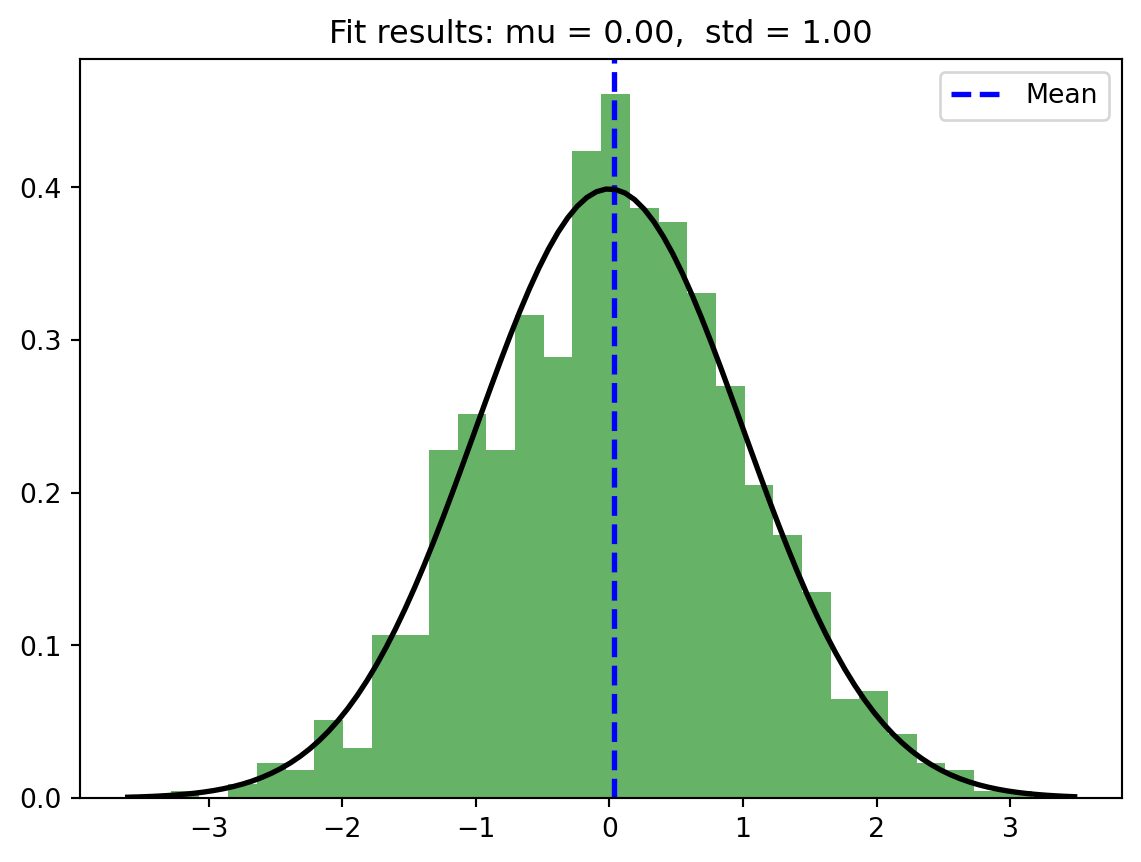
The above histogram (we will learn how to create these in the next chapter) shows an example of a normal distribution with a mean of 0 and a standard deviation of 1. The blue dashed line represents the mean of the dataset, which is also the center of the distribution. This is the core characteristic of a normal distribution: it is symmetric around the mean. It is stable and can be expressed mathematically. For instance, if a distribution is normal, we can predict one variable from another using the calculation y = mx + b, where m is the slope and b is the y-intercept (where x = 0). Similarly, the data is spread relatively evenly around the mean. It follows a bell-shaped curve and 66% of the data falls within one standard deviation of the mean, 95% falls within two standard deviations, and 99.7% falls within three standard deviations. Basically, the closer that a dataset is to a normal distribution, the more we can rely on these statistics to describe the dataset.